C, P, U, NP : HOW TO
Kenith Grey
2018-12-04
Required Libraries
require(ggplot2)
require(ggQC)
Example 1 : c Chart
Setup
set.seed(5555)
Process1 <- data.frame(Process_run_id=1:30,
                       Counts=rpois(n = 30, lambda = 25))
c_base <- ggplot(Process1, aes(x=Process_run_id, y = Counts))
Basic c chart
c_Chart <- c_base + geom_point() + geom_line() +
       stat_QC(method = "c", auto.label = T, label.digits = 2)

c_Chart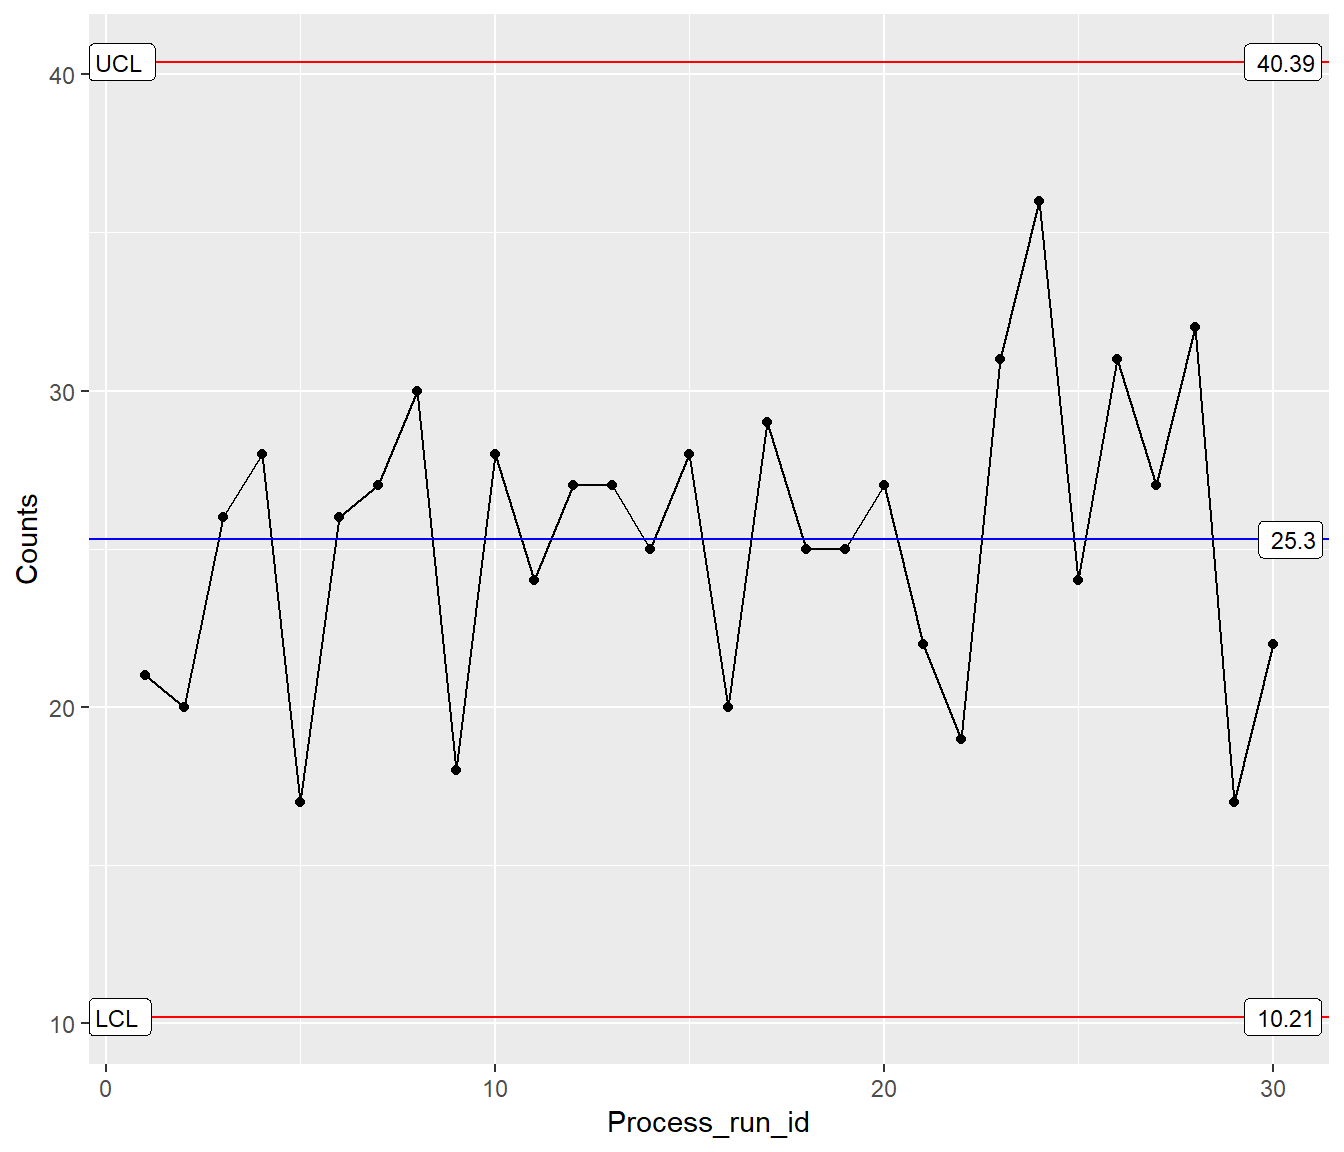
Example 2 : c Chart Facet
Setup
set.seed(5555)
Process1 <- data.frame(Process_run_id = 1:30,
                       Counts=rpois(n = 30, lambda = 25),
                       Group = "A")
Process2 <- data.frame(Process_run_id = 1:30,
                       Counts = rpois(n = 30, lambda = 5),
                       Group = "B")

all_processes <- rbind(Process1, Process2)

c_base <- ggplot(all_processes, aes(x=Process_run_id, y = Counts))
Facted c chart
c_Chart <- c_base + geom_point() + geom_line() +
       stat_QC(method = "c", auto.label = T, label.digits = 2) +
       facet_grid(.~Group)

c_Chart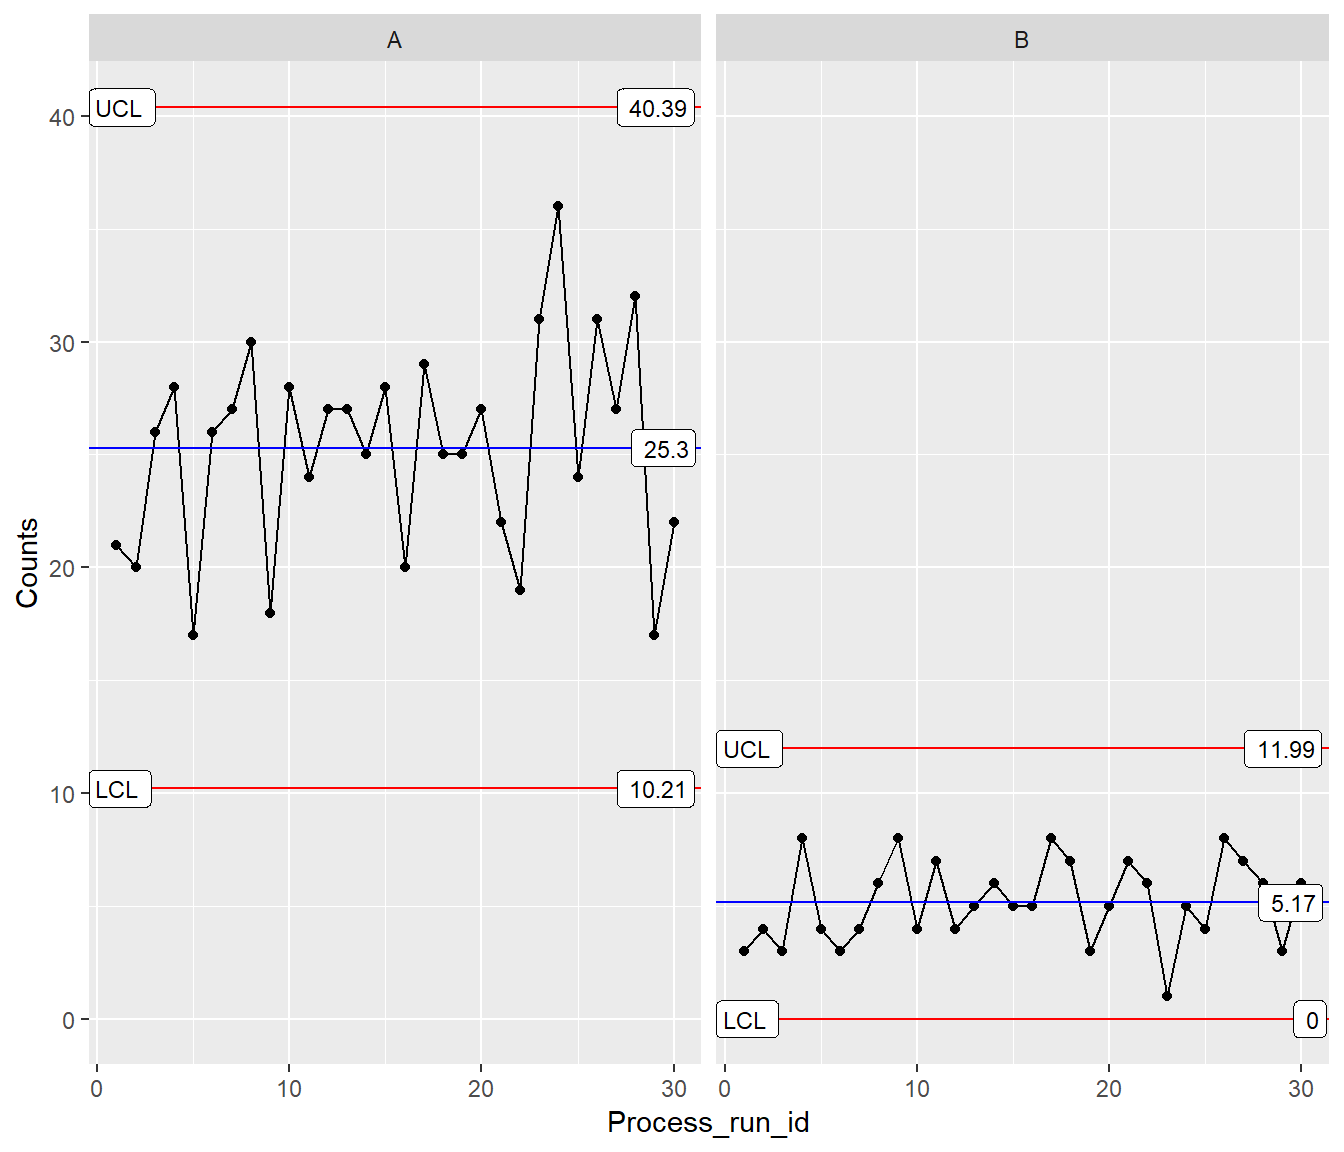
Example 3 : np Chart
Notes
- The constant “n” must be specified in stat_QC(method = “np”, n = ??)
- chart supports faceting
Setup
set.seed(5555)
np_data <- data.frame(
            trial=1:30,
            Number_Nonconforming = rbinom(30, 30, prob = .50),
            n = rep(15, 30))
Basic np chart
np_Chart <- ggplot(data = np_data, aes(trial, Number_Nonconforming)) +
  geom_point() + geom_line() +
  stat_QC(method = "np", n=30, auto.label = T, label.digits = 1)

np_Chart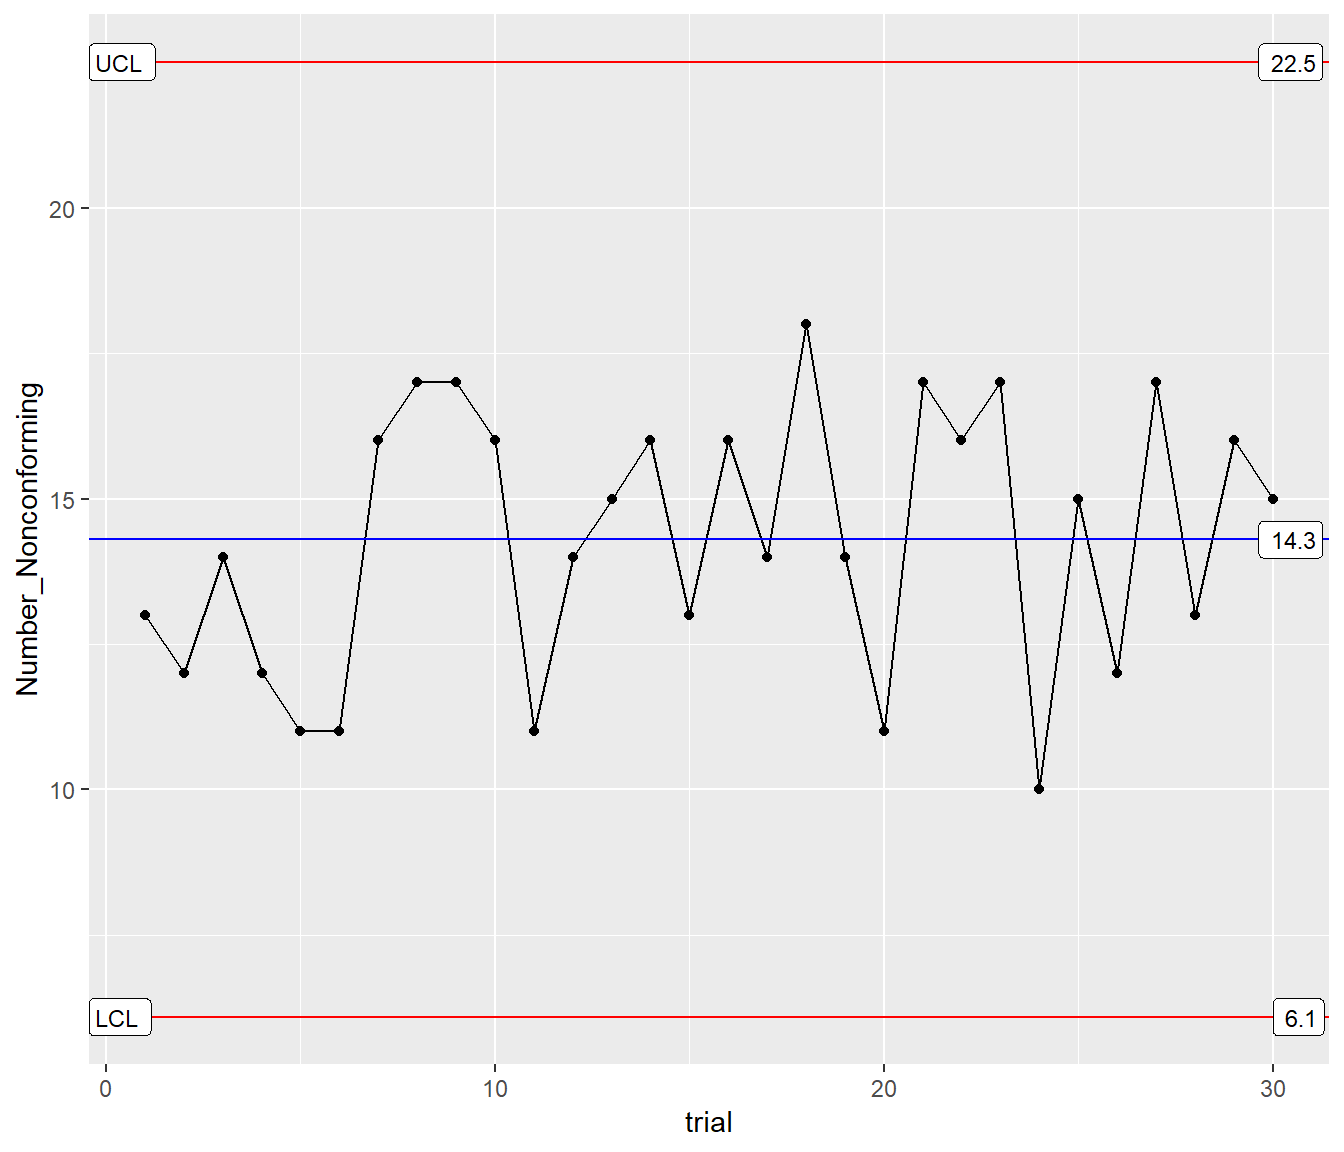
Example 4 : p Chart
Notes
- Here “n” is not constant and must be specified in the ggplot aes().
- if aes() arg. x is an ordered factor or coersed with as.ordered(), specify group = 1 in ggplot aes().
- chart supports faceting
Setup
set.seed(5555)
p_data <- data.frame(trial=1:30,
  Num_Incomplete_Items = rpois(30, lambda = 30),
  Num_Items_in_Set = runif(n = 30, min = 50, max = 100))

p_data$Proportion_Incomplete <- p_data$Num_Incomplete_Items/p_data$Num_Items_in_Set
Basic p chart
p_Chart <- ggplot(data = p_data, aes(trial, y=Proportion_Incomplete,
                            n=Num_Items_in_Set)) +
  geom_point() + geom_line() +
  stat_QC(method = "p")

p_Chart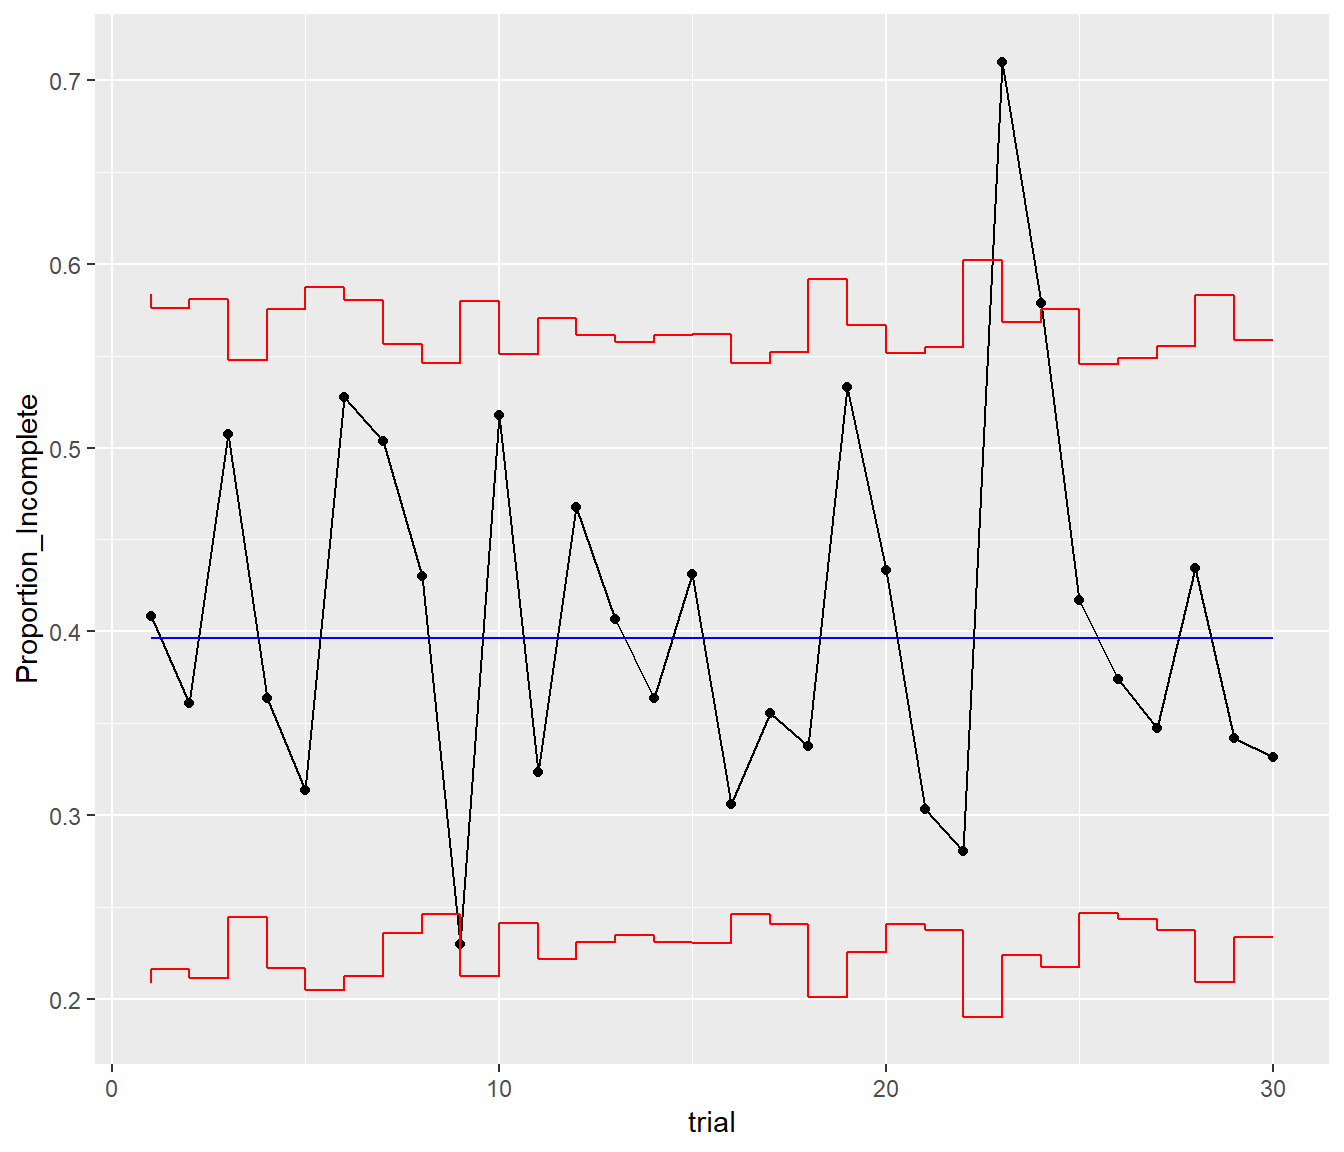
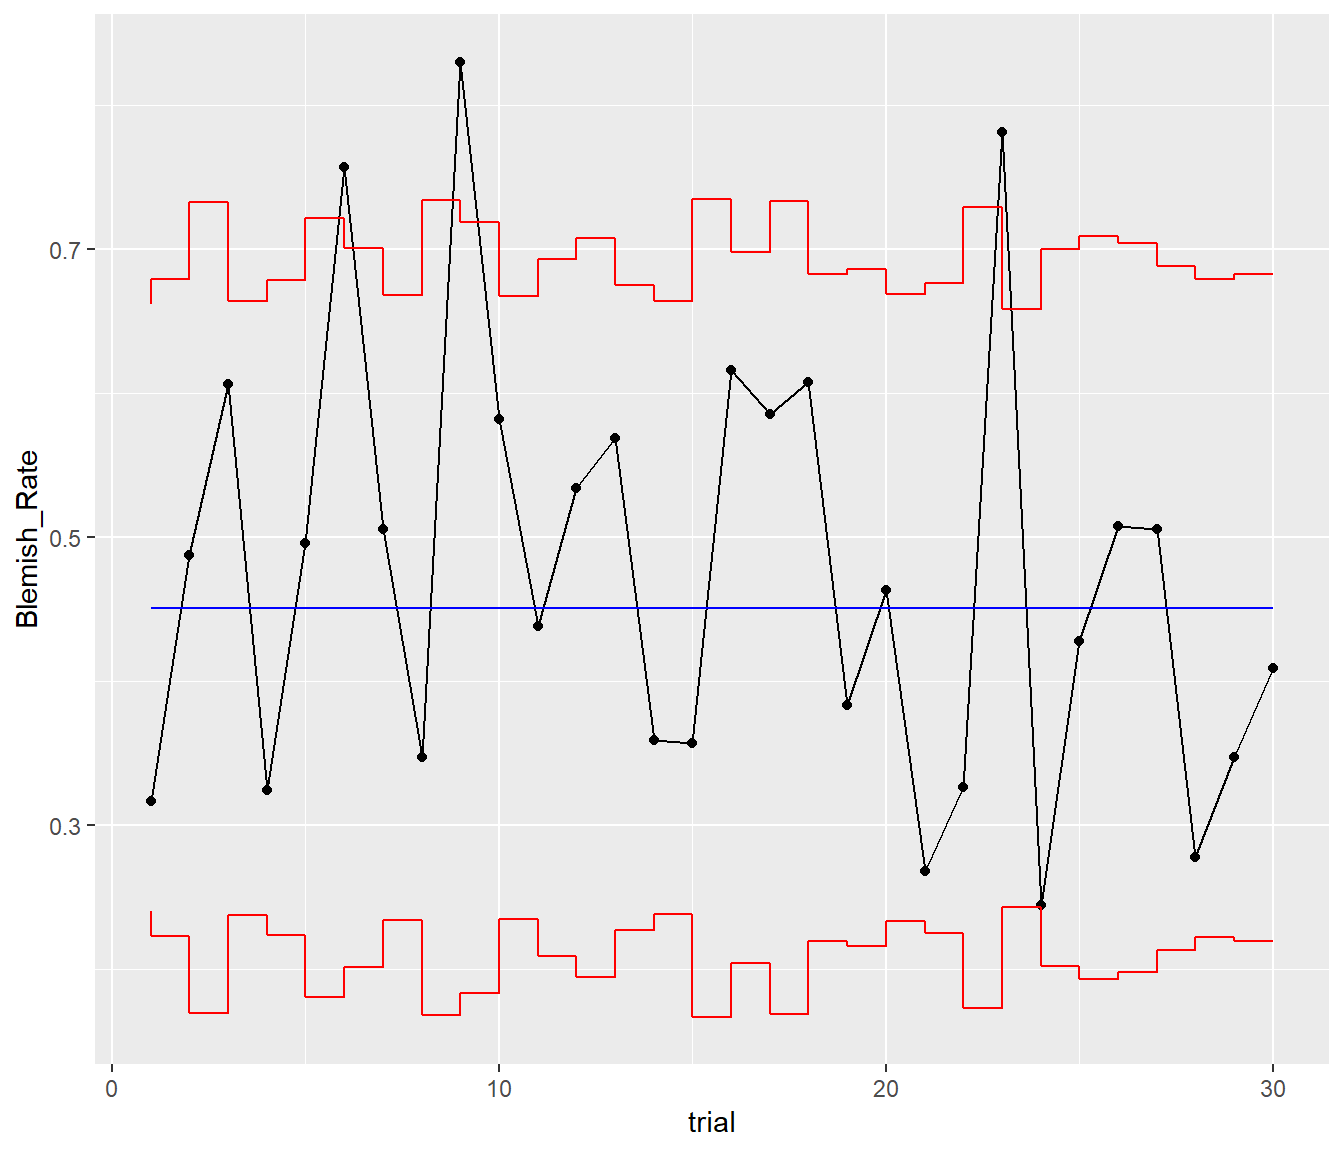
Example 5 : u Chart
Notes
- Here “n” is not constant and must be specified in the ggplot aes().
- if aes() arg. x is an ordered factor or coersed with as.ordered(), specify group = 1 in ggplot aes().
- chart supports faceting
Setup
set.seed(5556)
u_data <- data.frame(trial=1:30,
              Num_of_Blemishes = rpois(30, lambda = 30),
              Num_Items_Inspected = runif(n = 30, min = 50, max = 100)
          )

u_data$Blemish_Rate <- u_data$Num_of_Blemishes/u_data$Num_Items_Inspected
Basic u chart
u_chart <- ggplot(data = u_data, aes(x=trial,
                            y=Blemish_Rate,
                            n=Num_Items_Inspected)) +
           geom_point() + geom_line() +
           stat_QC(method = "u")

u_chart