HOW TO: XmR & mR Plots
Kenith Grey
2018-12-04
Required Libraries
require(ggplot2)
require(ggQC)
require(gridExtra)
Example 1 : Basic Plot
Setup
set.seed(5555)
Process1 <- data.frame(processID = as.factor(rep(1,20)),
                       metric_value = rnorm(20,0,1),
                       subgroup_sample=letters[1:20],
                       Process_run_id = 1:20)

INDV <- ggplot(Process1, aes(x=Process_run_id, y = metric_value))
Basic XmR-mR Plot
XmR <- INDV + geom_point() + geom_line() +
       stat_QC(method = "XmR", auto.label = T, label.digits = 2)

mR <- INDV +
     stat_QC(method = "mR", auto.label = T, label.digits = 2) +
     ylab("mR")

grid.arrange(XmR, mR, ncol=1)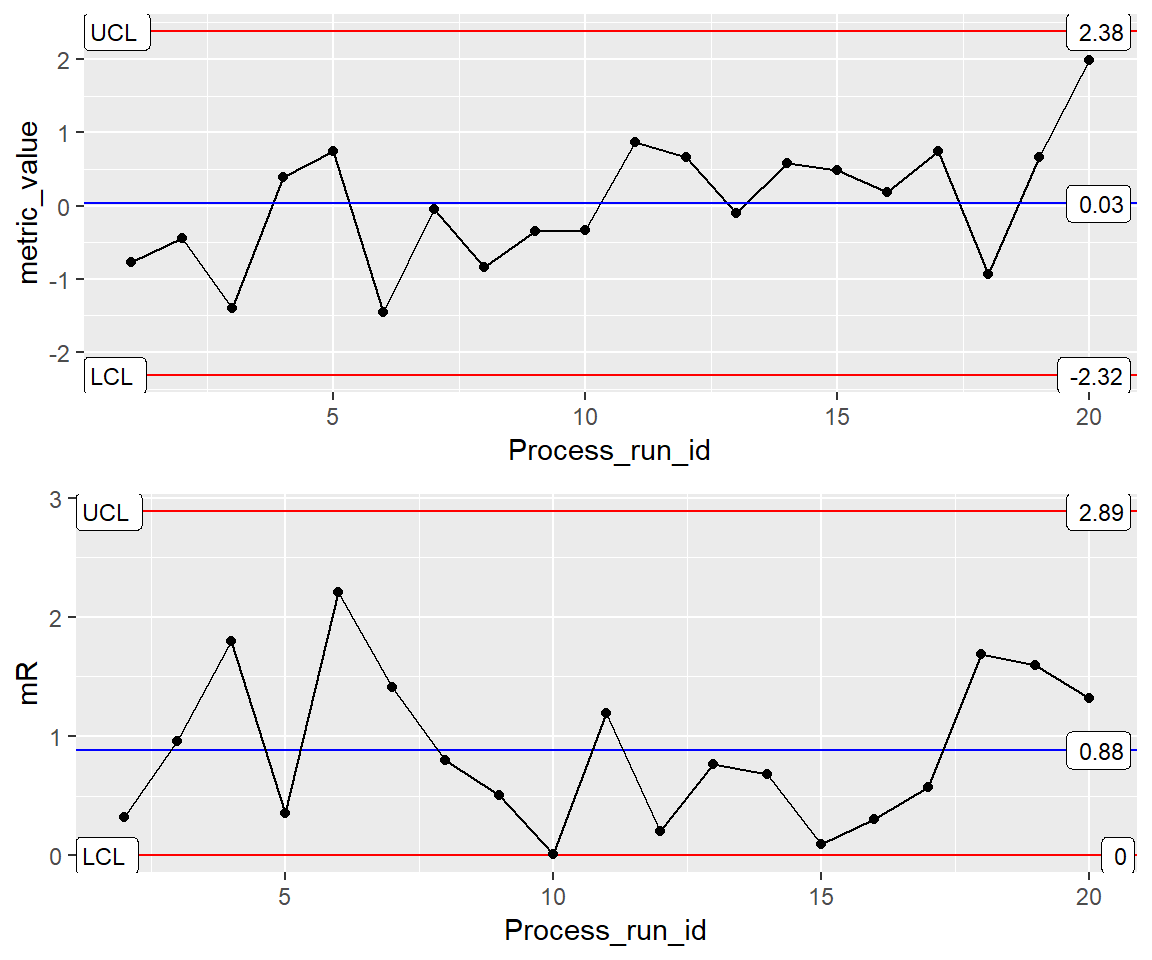
Example 2: x as Factor
Setup
INDV <- ggplot(Process1, aes(x=subgroup_sample, y = metric_value)) XmR-mR: x as factor (Wrong Way)
Oh my! looks like something went horrabily wrong. See fix below using group aesthetic.
XmR <- INDV + geom_point() + geom_line() +
       stat_QC(method = "XmR", auto.label = T, label.digits = 2)

mR <- INDV + stat_mR() +
      stat_QC(method = "mR", auto.label = T, label.digits = 2) +
      ylab("mR")

grid.arrange(XmR, mR, ncol=1)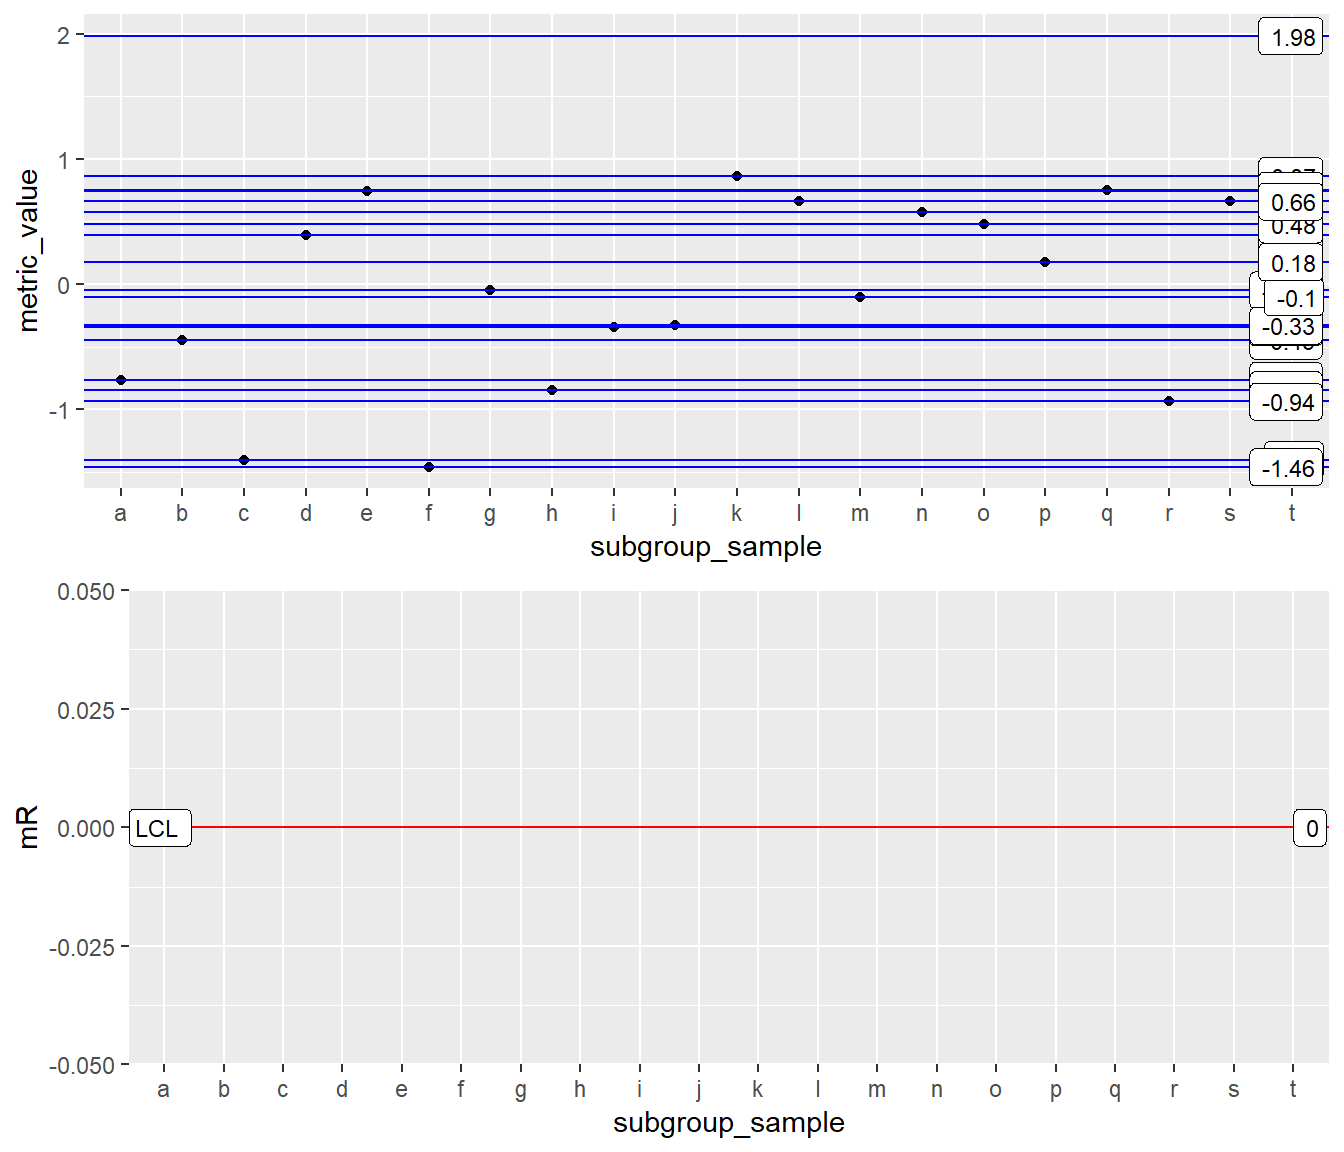
XmR-mR: x as factor (Right Way)
Issue solved using group asthetic (i.e, group=1).
INDV <- ggplot(Process1, aes(x=subgroup_sample, y = metric_value, group=1)) XmR <- INDV + geom_point() + geom_line() +
stat_QC(method = "XmR", auto.label = T, label.digits = 2)
mR <- INDV + stat_mR() +
stat_QC(method = "mR", auto.label = T, label.digits = 2) +
ylab("mR")
grid.arrange(XmR, mR, ncol=1)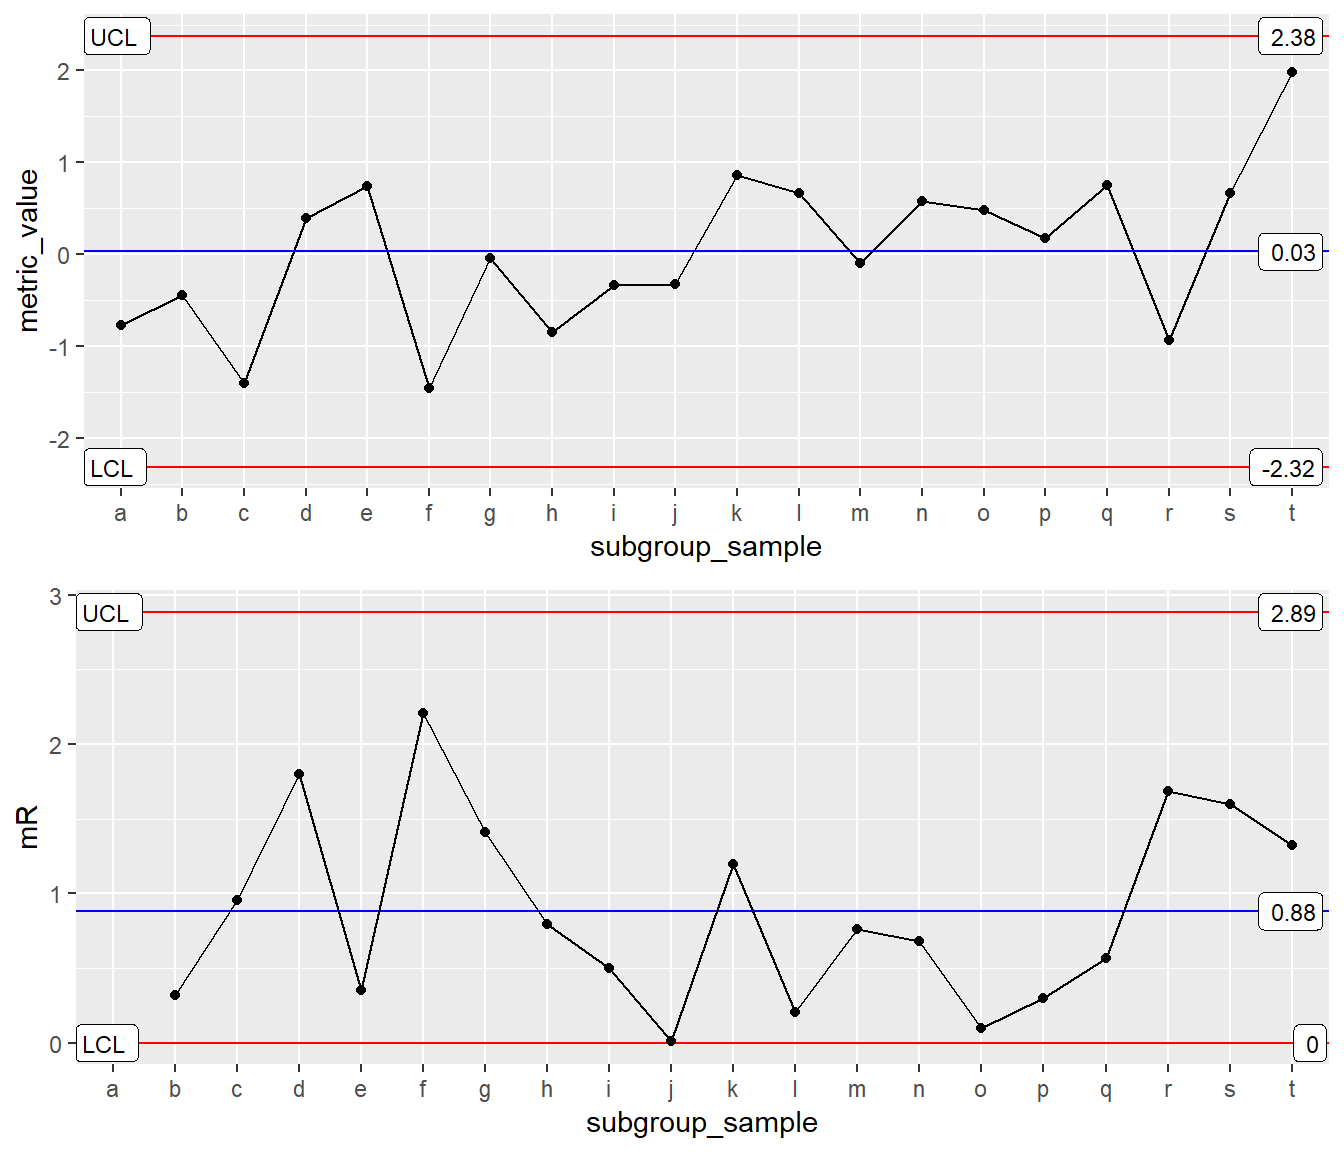
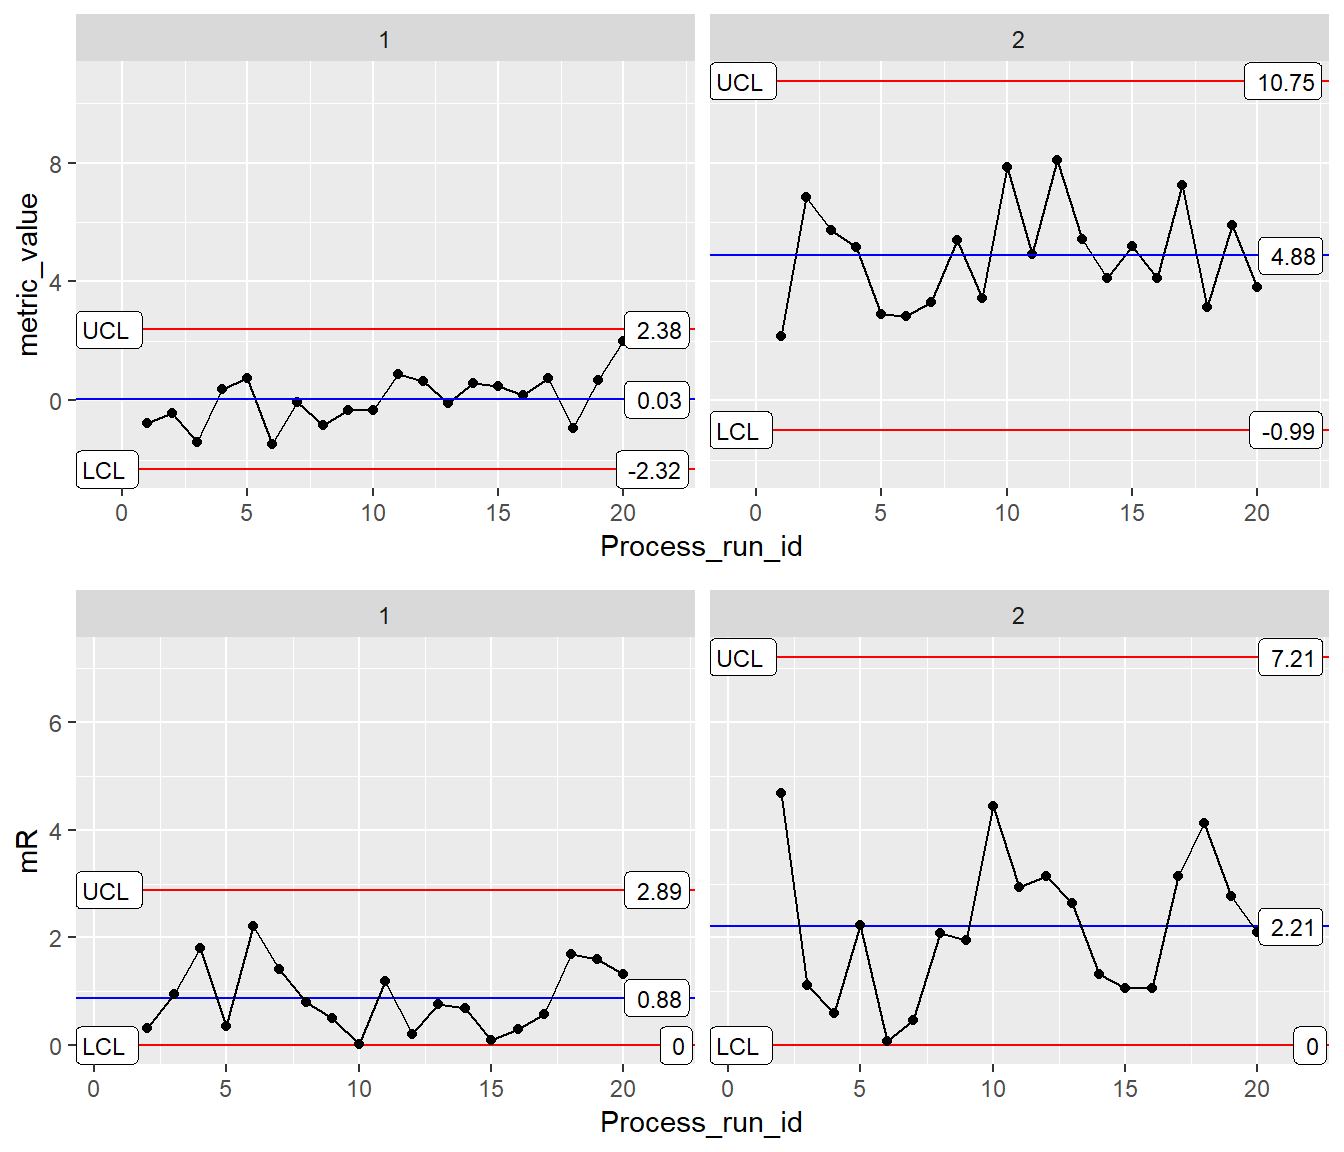
Example 3: XmR mR Faceting
Setup Faceting Data
Here we are using two processes and binding the data together into one data.frame
set.seed(5555)
Process1 <- data.frame(processID = as.factor(rep(1,20)),
                       metric_value = rnorm(20,0,1),
                       subgroup_sample=letters[1:20],
                       Process_run_id = 1:20)
Process2 <- data.frame(processID = as.factor(rep(2,20)),
                       metric_value = rnorm(20,5,2),
                       subgroup_sample=letters[1:20],
                       Process_run_id = 1:20)

BothProcesses <- rbind(Process1, Process2)
ggplot Faceting Init
INDV <- ggplot(BothProcesses, aes(x=Process_run_id, y = metric_value)) Basic XmR-mR Facet Plot
XmR <- INDV + geom_point() + geom_line() +
       stat_QC(method = "XmR", auto.label = T, label.digits = 2) +
       facet_grid(.~processID) +
       scale_x_continuous(expand =  expand_scale(mult = .15))  # Pad the x-axis

mR <- INDV +
      stat_QC(method = "mR", auto.label = T, label.digits = 2) +
      ylab("mR") +
      facet_grid(.~processID)+
      scale_x_continuous(expand =  expand_scale(mult = .15))  # Pad the x-axis

grid.arrange(XmR, mR, ncol=1)