stat_mR()
Kenith Grey
2018-12-04
Description
ggplot stat used to create a mR chart in ggplot. As of ggQC v0.0.3, the mR method can be called using stat_QC(method=“mR”).
Usage
stat_mR(mapping = NULL, data = NULL, geom = "point",
  position = "identity", show.legend = NA, inherit.aes = TRUE,
  na.rm = FALSE, color.mr_point = "black", color.mr_line = "black",
  color.qc_limits = "red", color.qc_center = "blue", ...)
Specialized Args: stat_mR()
color.mr_point : color, to be used for the mR points.
color.mr_line : color, to be used for line connecting points.
color.qc_limits : color, used to colorize the plot’s upper and lower mR control limits.
color.qc_center : color, used to colorize the plot’s center line.
text.size : number, size of the text label
… : other arguments passed on to layer. These are often aesthetics, used to set an aesthetic to a fixed value, like color = “red” or size = 3. They may also be parameters to the paired geom/stat.
Examples
# Setup Data --------------------------------------------------------------
set.seed(5555)
n = 10
Process1 <- data.frame(processID = as.factor(rep(1,n)),
                       metric_value = rnorm(n,0,1),
                       Process_run_id = 1:n)
Base Plot
This plot below is just the individual values for 10 points sampled out the the normal distribution.
#Before ggQC v0.0.3
mr_stat_mR <- ggplot(Process1, aes(x=Process_run_id, y = metric_value)) +
        ggtitle("stat_mR()", subtitle = "Yes, it's blank, go to next section") +
        scale_x_continuous(expand =  expand_scale(mult = .15)) #pad x-axis

#Preparing for stat_QC way of makring plot
mR_Stat_QC <- ggplot(Process1, aes(x=Process_run_id, y = metric_value)) +
  ggtitle("stat_QC(method='mR')", subtitle = "Yes, it's blank, go to next section") +
  scale_x_continuous(expand =  expand_scale(mult = .15)) #pad x-axis

gridExtra::grid.arrange(mr_stat_mR, mR_Stat_QC, nrow=1)
To get the mR plot for this data, you just call stat_mR() as shown in the next section. Notice that there is no call for geom_point() or geom_line().
mR Plot
mR <- mR_Stat_QC +
      stat_mR() +
      ggtitle("stat_mR()", subtitle = "uses stat_mR()")


#example of making graph with stat_QC()
MR2 <- mR_Stat_QC +
       stat_QC(method = "mR") +
       ggtitle("stat_QC(method='mR')", subtitle = "uses stat_QC()")

gridExtra::grid.arrange(mR, MR2, nrow=1)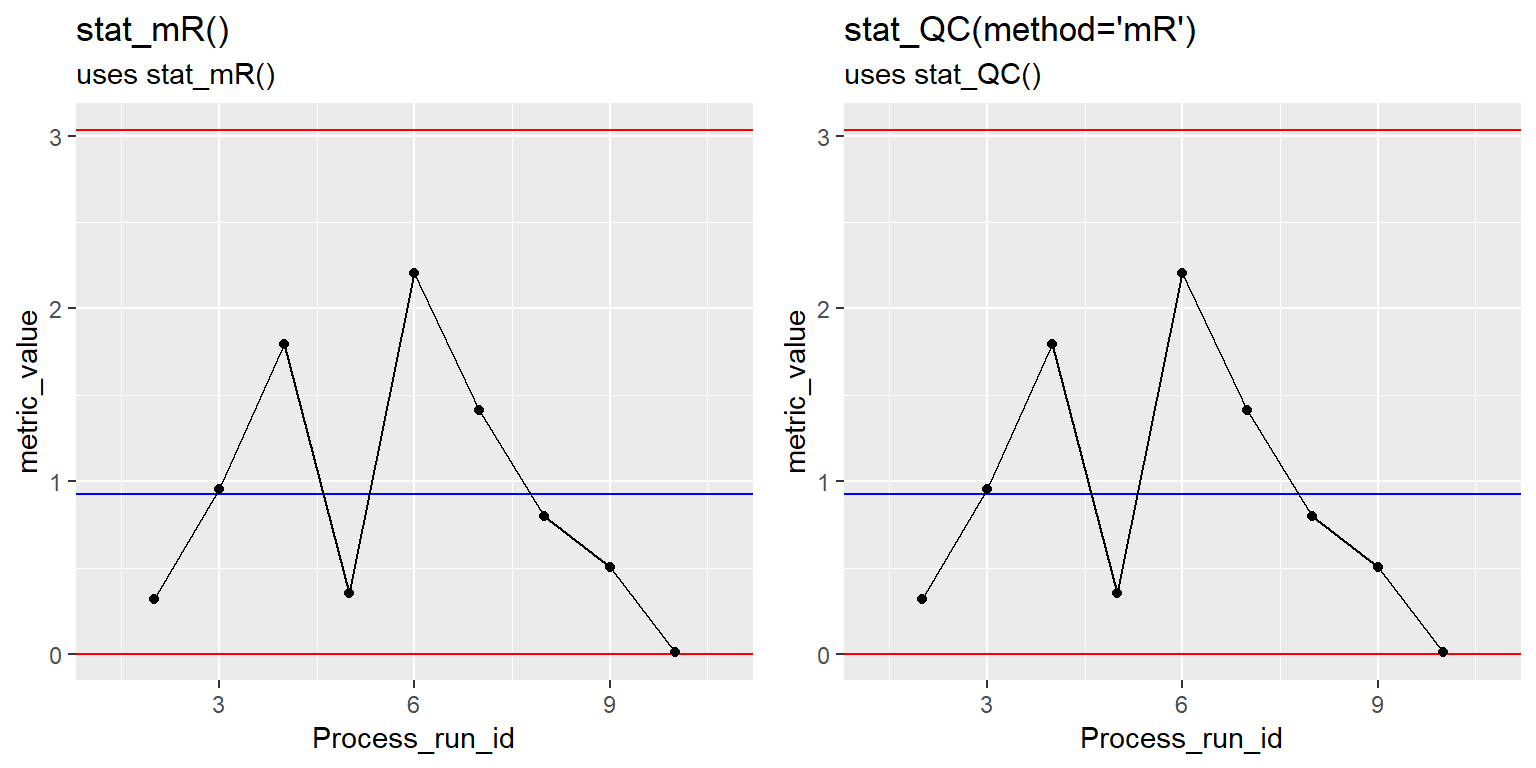
mR Plot Lables
mR <- mR_Stat_QC +
      stat_mR() +
      stat_QC_labels(method = "mR", digits = 3) +
      ggtitle("stat_mR()", subtitle = "uses stat_mR()")

MR2 <- mR_Stat_QC +
       stat_QC(method = "mR", auto.label = T, label.digits = 3) +
       ggtitle("stat_QC(method='mR')", subtitle = "uses stat_QC()")

gridExtra::grid.arrange(mR, MR2, nrow=1)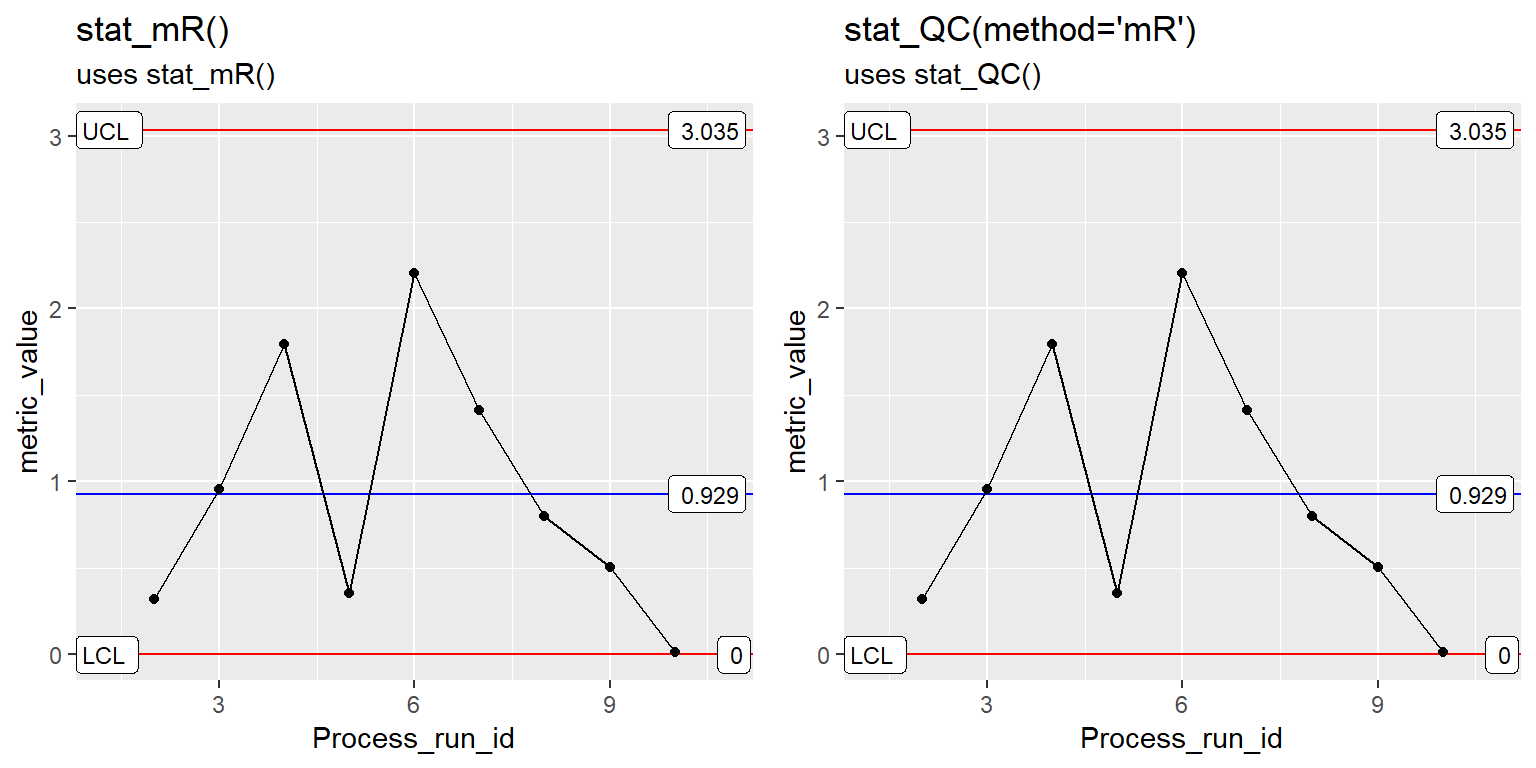
Change mR Plot Point Color
mR <- ggplot(Process1, aes(x=Process_run_id, y = metric_value)) +
       stat_mR(color.mr_point = "red") +
       ggtitle("stat_mR()", subtitle = "uses stat_mR()")

#example of making graph with stat_QC()
MR2 <- mR_Stat_QC + stat_QC(method = "mR", color.point = "red") +
       ggtitle("stat_QC(method='mR')", subtitle = "uses stat_QC()")

gridExtra::grid.arrange(mR, MR2, nrow=1)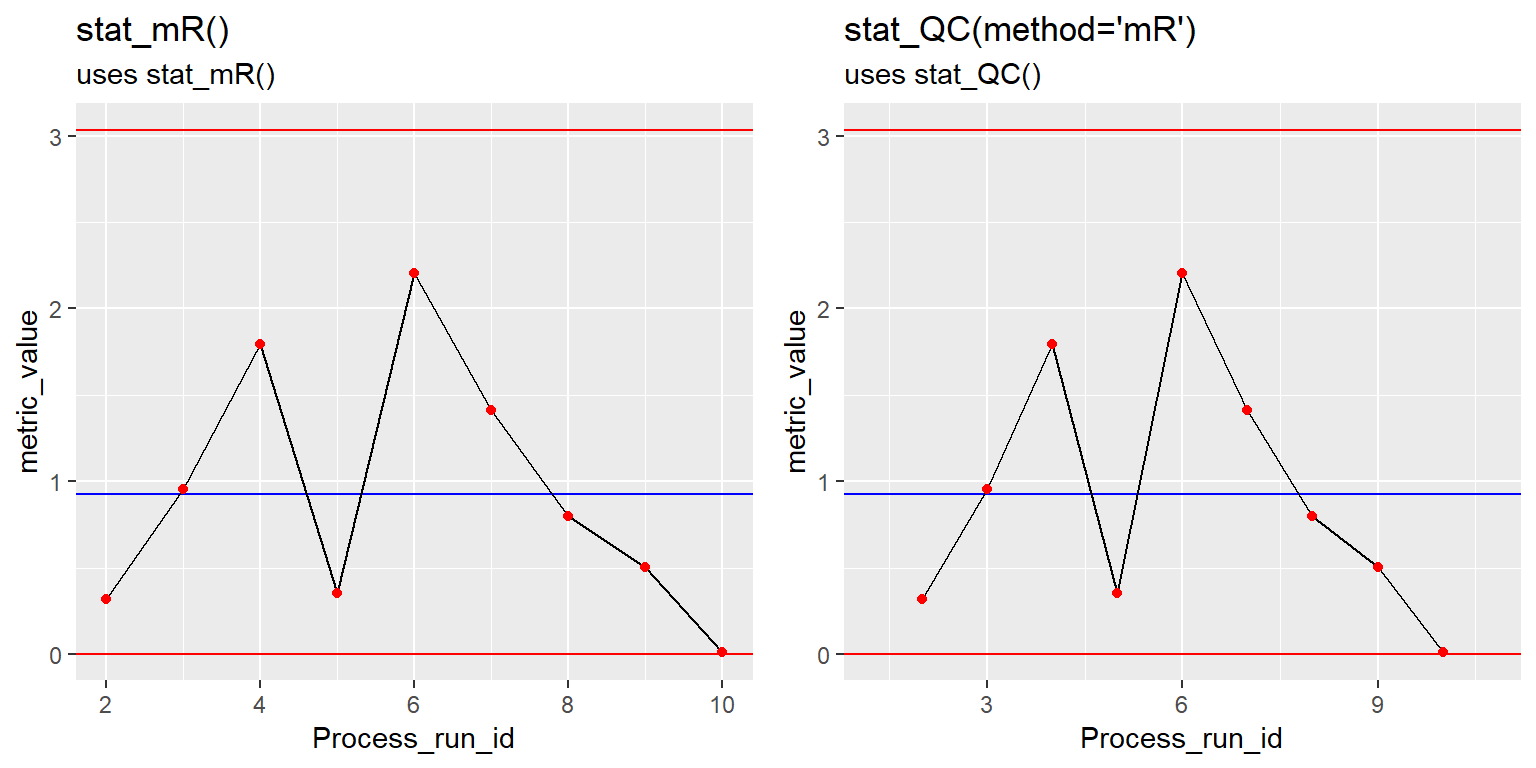
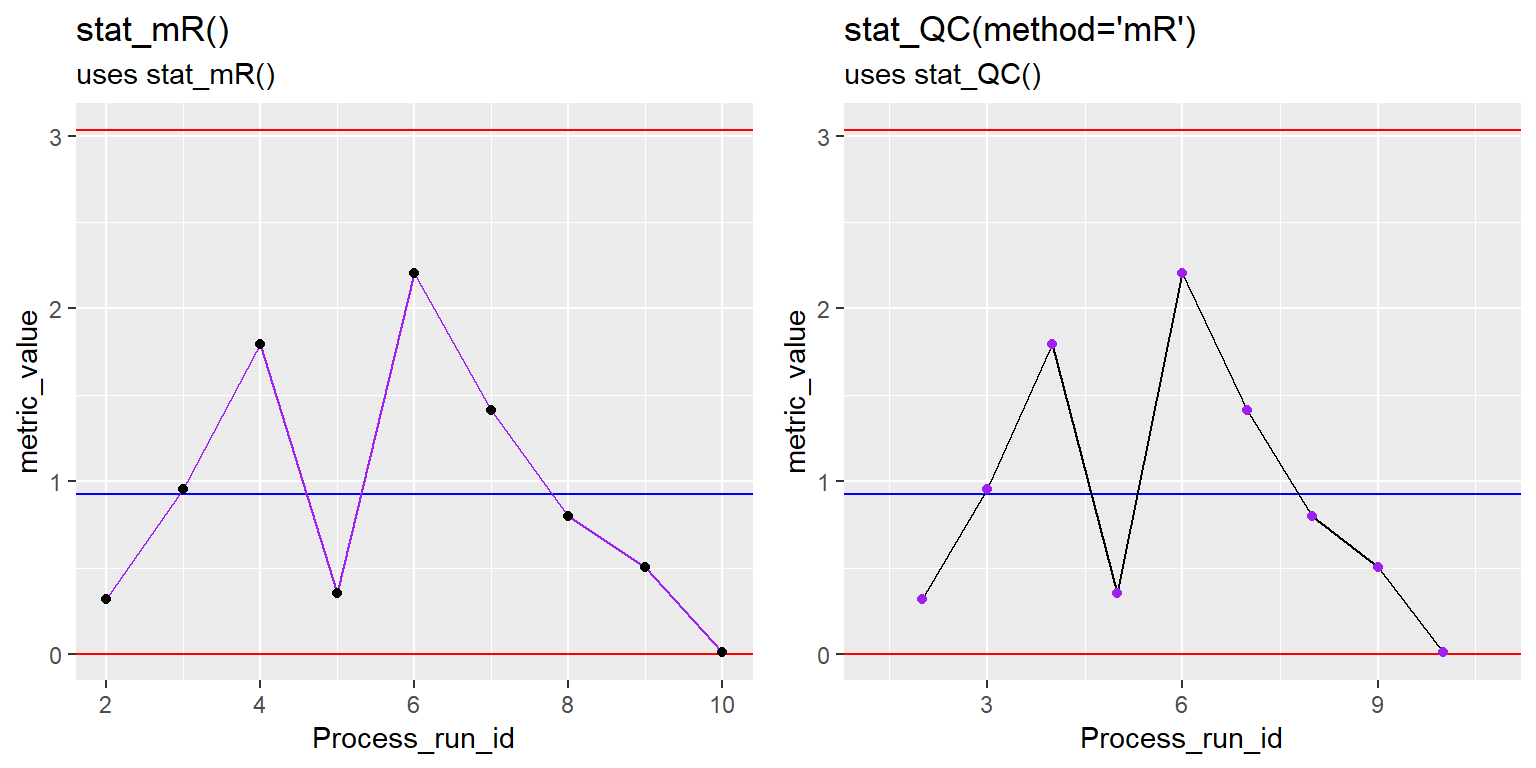
Change mR Plot Line Color
mR <- ggplot(Process1, aes(x=Process_run_id, y = metric_value)) +
       stat_mR(color.mr_line = "purple") +
       ggtitle("stat_mR()", subtitle = "uses stat_mR()")

#example of making graph with stat_QC()
MR2 <- mR_Stat_QC + stat_QC(method = "mR", color.point = "purple") +
       ggtitle("stat_QC(method='mR')", subtitle = "uses stat_QC()")

gridExtra::grid.arrange(mR, MR2, nrow=1)