stat_QC_labels()
Kenith Grey
2018-12-04
Description
Write QC line lables to ggplot QC Charts. Useful if you want to see the value of the center line and QC limits. see method argument for methods supported.
This function has been largely replaced by setting stat_QC(auto.label=T) when you specify stat_QC. However, there may be times when stat_QC_labels() provides you with additional control.
Usage
stat_QC_labels(mapping = NULL, data = NULL, geom = "label",
position = "identity", na.rm = FALSE, show.legend = NA,
inherit.aes = TRUE, n = NULL, digits = 1, method = "xBar.rBar",
color.qc_limits = "red", color.qc_center = "black", text.size = 3,      ...)
Specialized Args: Stat_QC_labels()
n: number, for
- Studentized Charts, used for custom or hypothetical subgroup size.
- np Charts, used to specify a fixed area of opportunity.
digits integer, indicating the number of decimal places
method : string, calling the following methods:
- Individuals Charts: mR, XmR,
- Attribute Charts: c, np, p, u,
- Studentized Charts: xBar.rBar, xBar.rMedian, xBar.sBar, xMedian.rBar, xMedian.rMedian
- Dispersion Charts: rBar, rMedian, sBar.
color.qc_limits : color, used to colorize the plot’s upper and lower mR control limits.
color.qc_center : color, used to colorize the plot’s center line.
text.size : number, size of the text label
…: other arguments passed on to layer. These are often aesthetics, used to set an aesthetic to a fixed value, like color = “red” or size = 3. They may also be parameters to the paired geom/stat.
Examples
# Setup Data --------------------------------------------------------------
set.seed(5555)
Process1 <- data.frame(processID = as.factor(rep(1,100)),
                       metric_value = rnorm(100,0,1),
                       subgroup_sample=rep(1:20, each=5),
                       Process_run_id = 1:100)
Base Plot
INDV <- ggplot(Process1, aes(x=Process_run_id, y = metric_value)) +
       geom_point() + geom_line()
INDV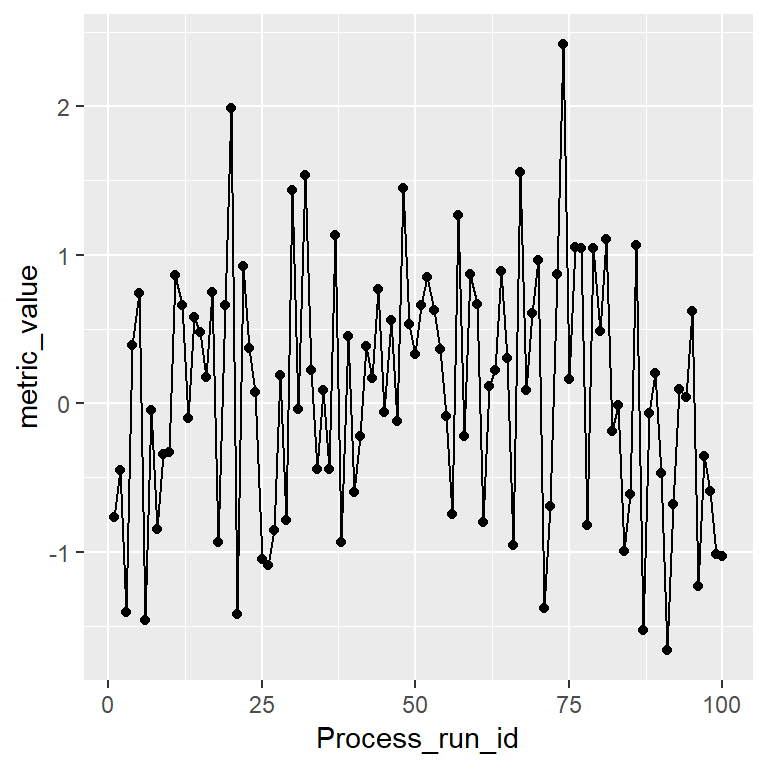
XmR Default Overlay with XmR Labels
INDV + stat_QC(method="XmR") +
  stat_QC_labels(method="XmR")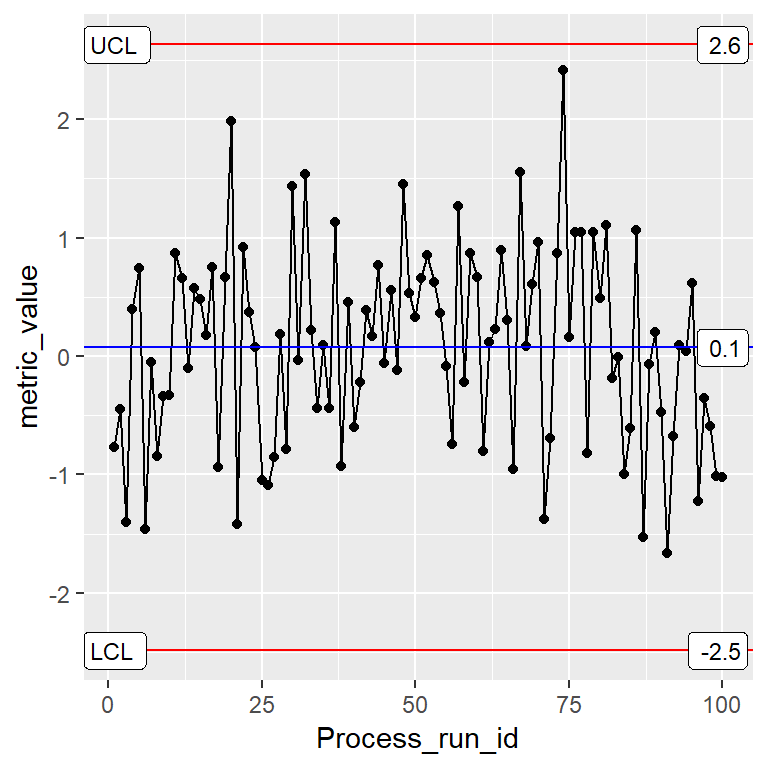
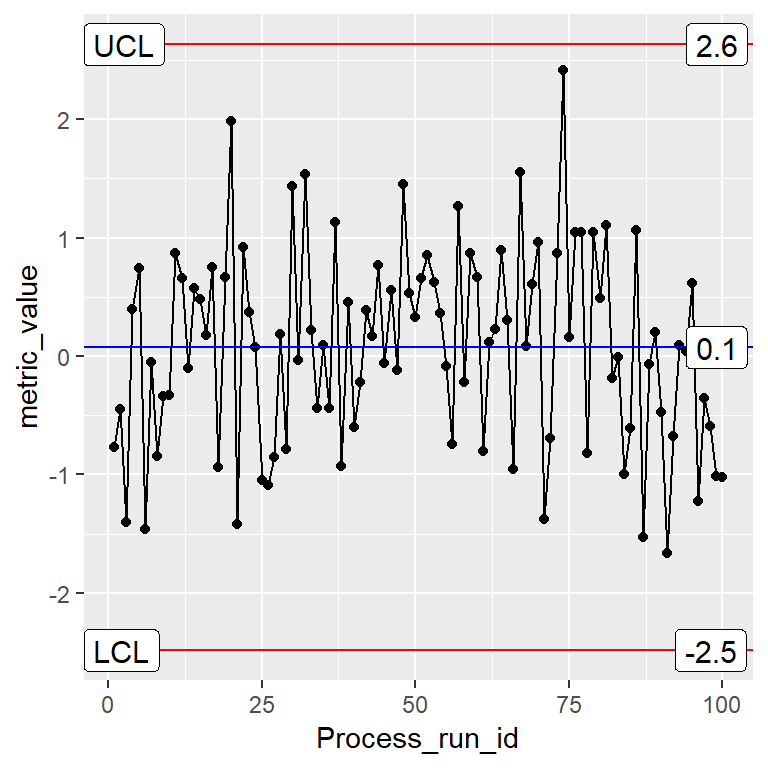
Change Center-Label Color
INDV + stat_QC(method="XmR") +
  stat_QC_labels(method="XmR", color.qc_center = "blue")
Change Limit-Label Color
INDV + stat_QC(method="XmR") +
  stat_QC_labels(method="XmR", color.qc_limits = "green")
Change Label Size
INDV + stat_QC(method="XmR") +
  stat_QC_labels(method="XmR", text.size = 4)