stat_qc_violations()
Kenith Grey
2018-12-04
Description
ggplot stat function that renders a faceted plot of QC violations based on the following 4 rules:
- Violation Same Side: 8 or more consecutive, same-side points
- Violation 1 Sigma: 4 or more consecutive, same-side points exceeding 1 sigma
- Violation 2 Sigma: 2 or more consecutive, same-side points exceeding 2 sigma
- Violation 3 Sigma: any points exceeding 3 sigma
Usage
stat_qc_violations(mapping = NULL, data = NULL, geom = "point",
position = "identity", show.legend = NA, inherit.aes = TRUE,
na.rm = FALSE, method = "xBar.rBar", geom_points = TRUE,
geom_line = TRUE, point.size = 1.5, point.color = "black",
violation_point.color = "red", rule.color = "darkgreen",
line.color = NULL, ...)
Specialized Args: Stat_QC()
method : string, calling the following methods:
- Individuals Charts: XmR,
- Studentized Charts: xBar.rBar, xBar.rMedian, xBar.sBar, xMedian.rBar, xMedian.rMedian
geom_points: boolean, draw points
geom_line: boolean, draw line
point.size: number, size of points on chart
point.color: string, color of points on charts (e.g., “black”)
violation_point.color: string, color of viloation points on charts (e.g., “red”)
rule.color: string, color or horizontal rules indicateing distribution center and sigma levels
show.facets: vector, selects violation facet 1 through 4. eg., c(1:4), c(1,4)
line.color: string, color of lines connecting points
…: other arguments passed on to layer. These are often aesthetics, used to set an aesthetic to a fixed value, like color = “red” or size = 3. They may also be parameters to the paired geom/stat.
Value
Faceted plot showing violations
Examples
Example 1: XmR Check Violations
# Setup Data --------------------------------------------------------------

    set.seed(5555)
    QC_XmR <- data.frame(
    data = c(c(-1, 2.3, 2.4, 2.5),                        #Outlier Data
          sample(c(rnorm(60),5,-5), 62, replace = FALSE), #Normal Data
          c(1,-.3, -2.4,-2.6,-2.5,-2.7, .3)),             #Outlier Data
    Run_Order = 1:73                                      #Run Order
    )
# Render QC Viloation Plot ------------------------------------------------------
Show.All.Facets <-
ggplot(QC_XmR, aes(x = Run_Order, y = data)) +
stat_qc_violations(method = "XmR") + #Makes facet graph with viloations
ggtitle("Show All Facets")
Show.4th.Facet <-
ggplot(QC_XmR, aes(x = Run_Order, y = data)) +
stat_qc_violations(method = "XmR", #Makes facet graph with viloations
show.facets = 4) + #Seclect the 4th Facet
ggtitle("Show 4th Facet Only")
gridExtra::grid.arrange(Show.All.Facets, Show.4th.Facet)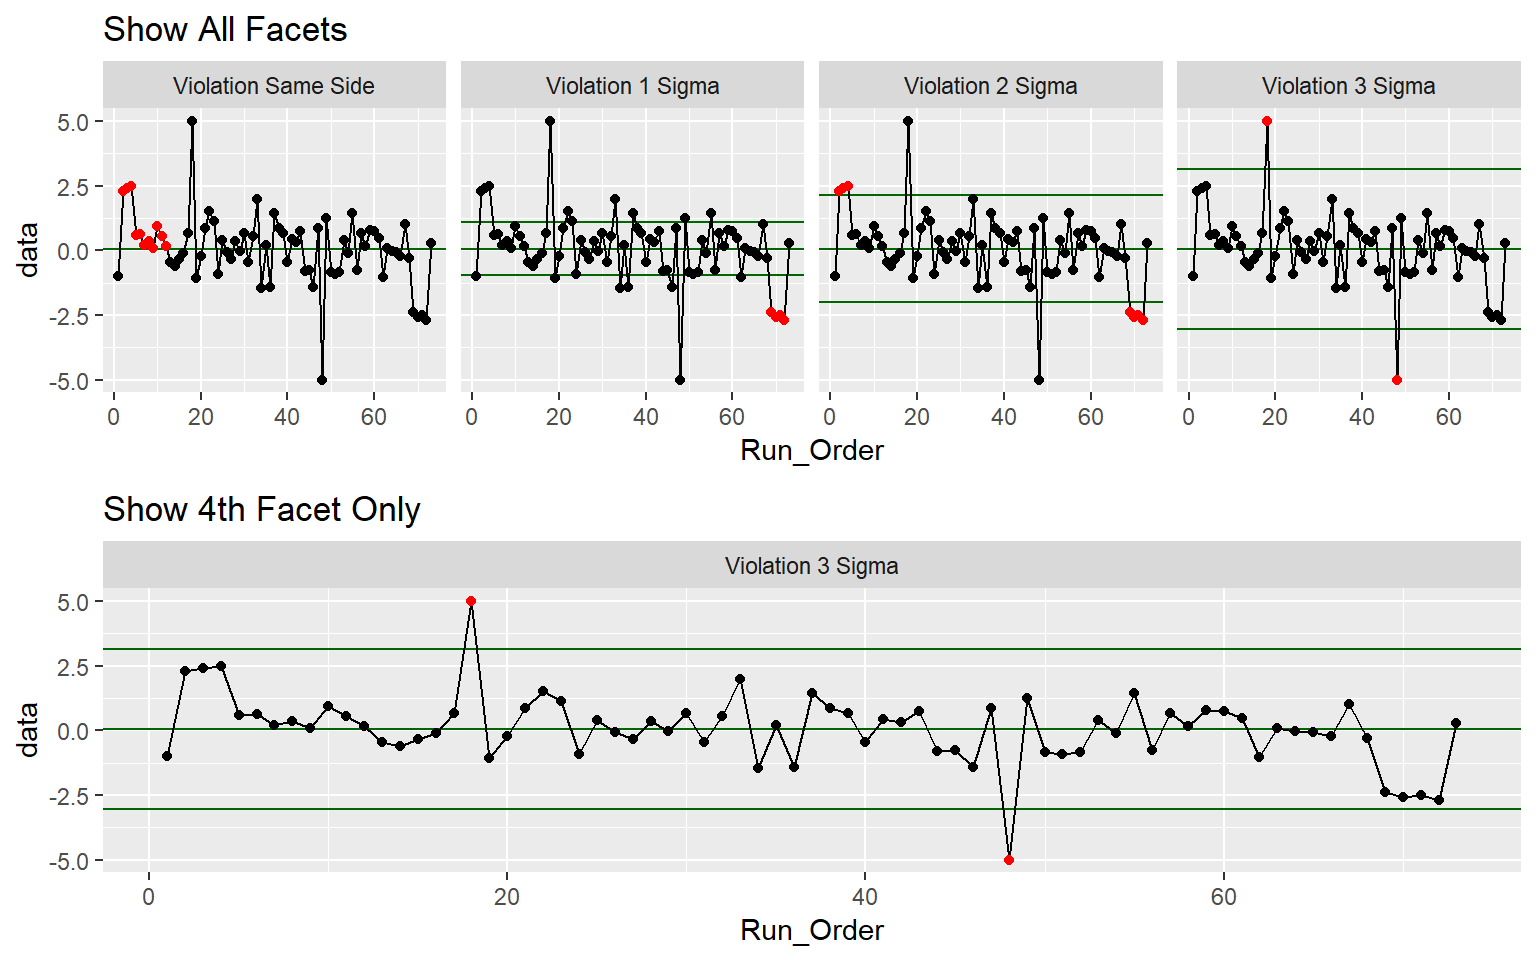
Example 2: Xbar Check Violations
# Setup Some Data ------------------------------------------------------------
     QC_xBar.rBar <- do.call(rbind, lapply(1:3, function(X){
       set.seed(5555+X)                                   #Loop over 3 seeds
       data.frame(
         sub_group = rep(1:42),                           #Define Subgroups
         sub_class = letters[X],
         c(
          c(runif(n = 5, min = 2.0,3.2)),                 #Outlier Data
          sample(c(rnorm(30),5,-4), 32, replace = FALSE), #Normal Data
          c(runif(n = 5, min = -3.2, max = -2.0))         #Outlier Data
         )
      )
     }
   )
)

colnames(QC_xBar.rBar) <- c("sub_group","sub_class", "value")
# Render QC Viloation Plot --------------------------------------------------
Show.All.Facets <- ggplot(QC_xBar.rBar, aes(x = sub_group, y = value)) +
stat_qc_violations(method = "xBar.rBar") +
#stat_qc_violations(method="xBar.rMedian")
#stat_qc_violations(method="xBar.sBar")
#stat_qc_violations(method="xMedian.rBar")
#stat_qc_violations(method="xMedian.rMedian")
ggtitle("Show All Facets")
Show.1st.4th.Facet <-
ggplot(QC_xBar.rBar, aes(x = sub_group, y = value)) +
stat_qc_violations(method = "xBar.rBar", #Makes facet graph with viloations
show.facets = c(1,4)) + #Seclect the 1st & 4th Facet
ggtitle("Show 1st and 4th Facet Only")
gridExtra::grid.arrange(Show.All.Facets, Show.1st.4th.Facet)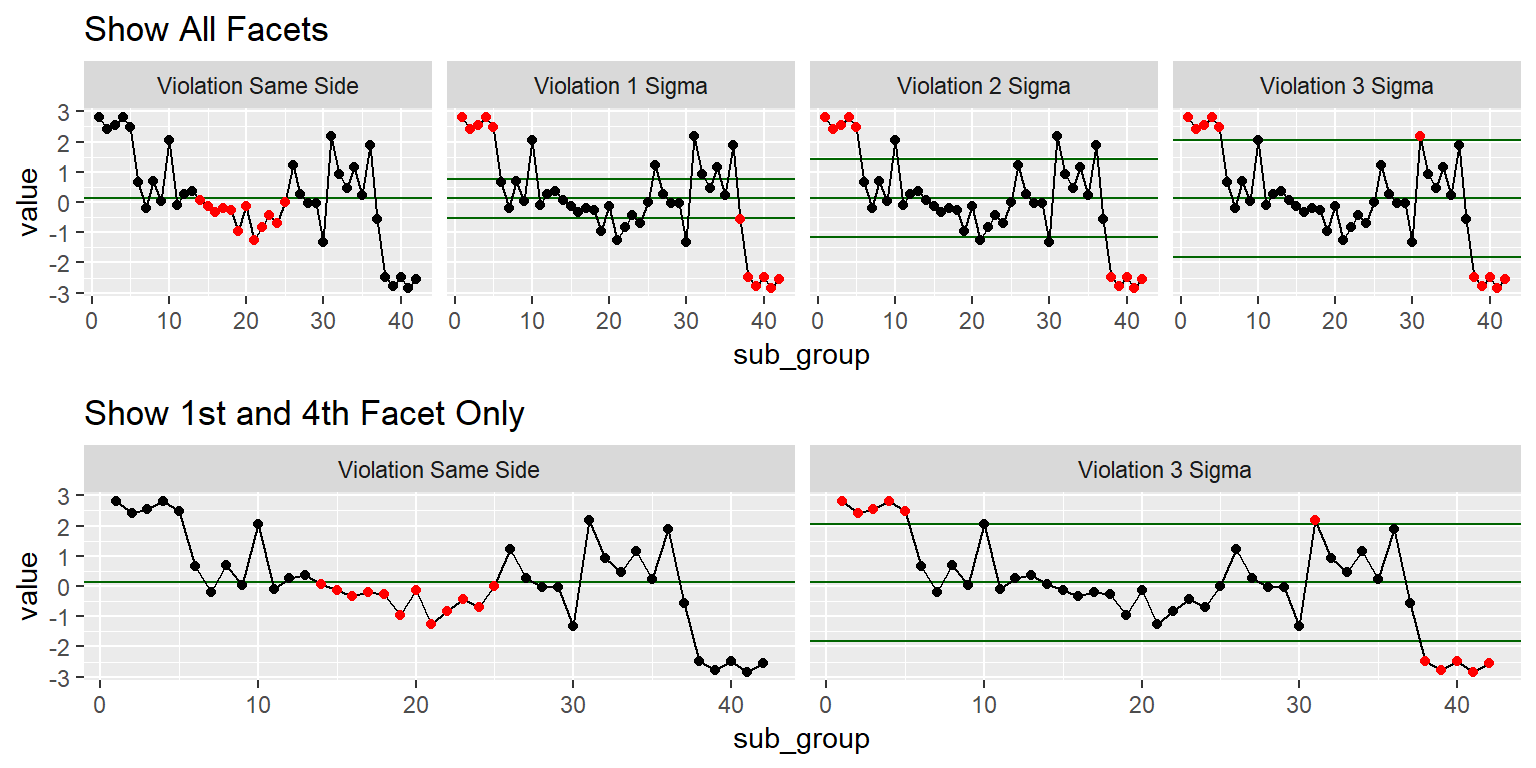
Complete User Control Example - Bypass stat_qc_violations()
#### The code below has two options if you are looking for complete
#### control over the look and feel of the graph. Use option 1 or option
#### 2 as appropriate. If you want something quick and easy use examples above.

##### Option 1: Setup for XmR Type Data
 # QC_XmR: Defined in Example 1
   QC_Vs <- QC_Violations(data  = QC_XmR$data, method = "XmR")
   QC_Stats <- QC_Lines(data  = QC_XmR$data, method = "XmR")
   MEAN <- QC_Stats$mean
   SIGMA <- QC_Stats$sigma

##### Option 2: Setup for xBar.rBar Type Data
 # QC_xBar.rBar: Defined in Example 2
   QC_Vs <- QC_Violations(data  = QC_xBar.rBar,
                          formula = value~sub_group,
                          method = "xBar.rBar")
   QC_Stats <- QC_Lines(data  = QC_xBar.rBar,
                        formula = value~sub_group,
                        method = "xBar.rBar")
   MEAN <- QC_Stats$xBar_Bar
   SIGMA <- QC_Stats$sigma

##### Setup second table for horizontal rules
 FacetNames <- c("Violation Same Side",
                 "Violation 1 Sigma",
                 "Violation 2 Sigma",
                 "Violation 3 Sigma")

 QC_Vs$Violation_Result <- ordered(QC_Vs$Violation_Result,
                                     levels=FacetNames)

 QC_Stats_df <- data.frame(
   Violation_Result = factor(x = FacetNames, levels = FacetNames),
   SigmaPlus = MEAN+SIGMA*0:3,
   MEAN = MEAN,
   SigmaMinus = MEAN-SIGMA*0:3
 )
Make Plot
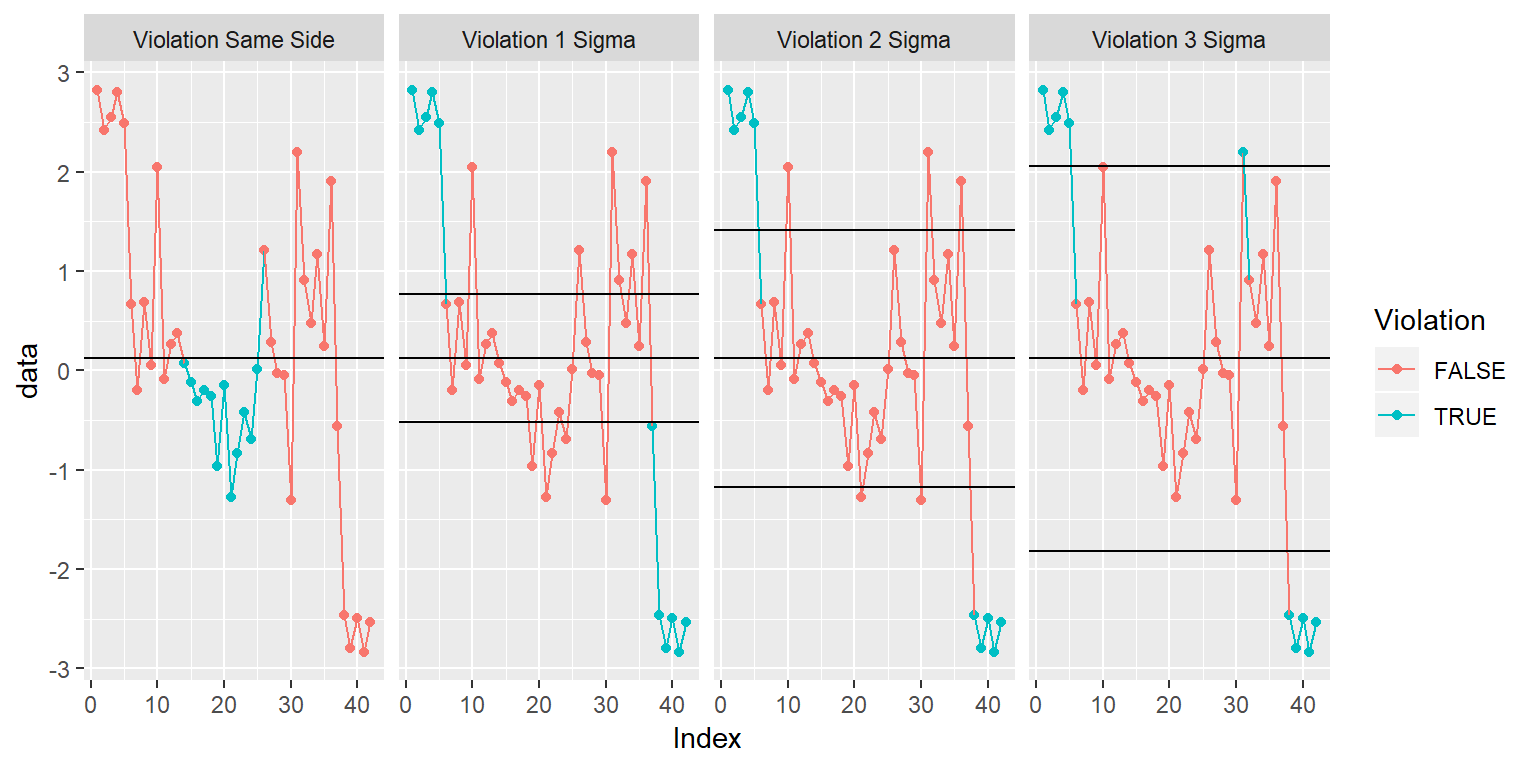
##### Make the Plot
 ggplot(QC_Vs, aes(x=Index, y=data, color=Violation, group=1)) +
   geom_point() + geom_line() +
   facet_grid(.~Violation_Result) +
   geom_hline(data = QC_Stats_df, aes(yintercept = c(SigmaPlus))) +
   geom_hline(data = QC_Stats_df, aes(yintercept = c(SigmaMinus))) +
   geom_hline(data = QC_Stats_df, aes(yintercept = c(MEAN)))