Two Way Charts
Kenith Grey
2018-12-04
Required Libraries
require(ggplot2)
require(ggQC)
require(gridExtra)
Example 1 : XmR & mR
Setup
set.seed(5555)
Process1 <- data.frame(processID = as.factor(rep(1,20)),
                       metric_value = rnorm(20,0,1),
                       subgroup_sample=letters[1:20],
                       Process_run_id = 1:20)

INDV <- ggplot(Process1, aes(x=Process_run_id, y = metric_value))
XmR-mR Plot
XmR <- INDV + geom_point() + geom_line() +
       stat_QC(method = "XmR", auto.label = T, label.digits = 2)

mR <- INDV +
      stat_QC(method = "mR", auto.label = T, label.digits = 2) +
      ylab("mR")

grid.arrange(XmR, mR, ncol=1)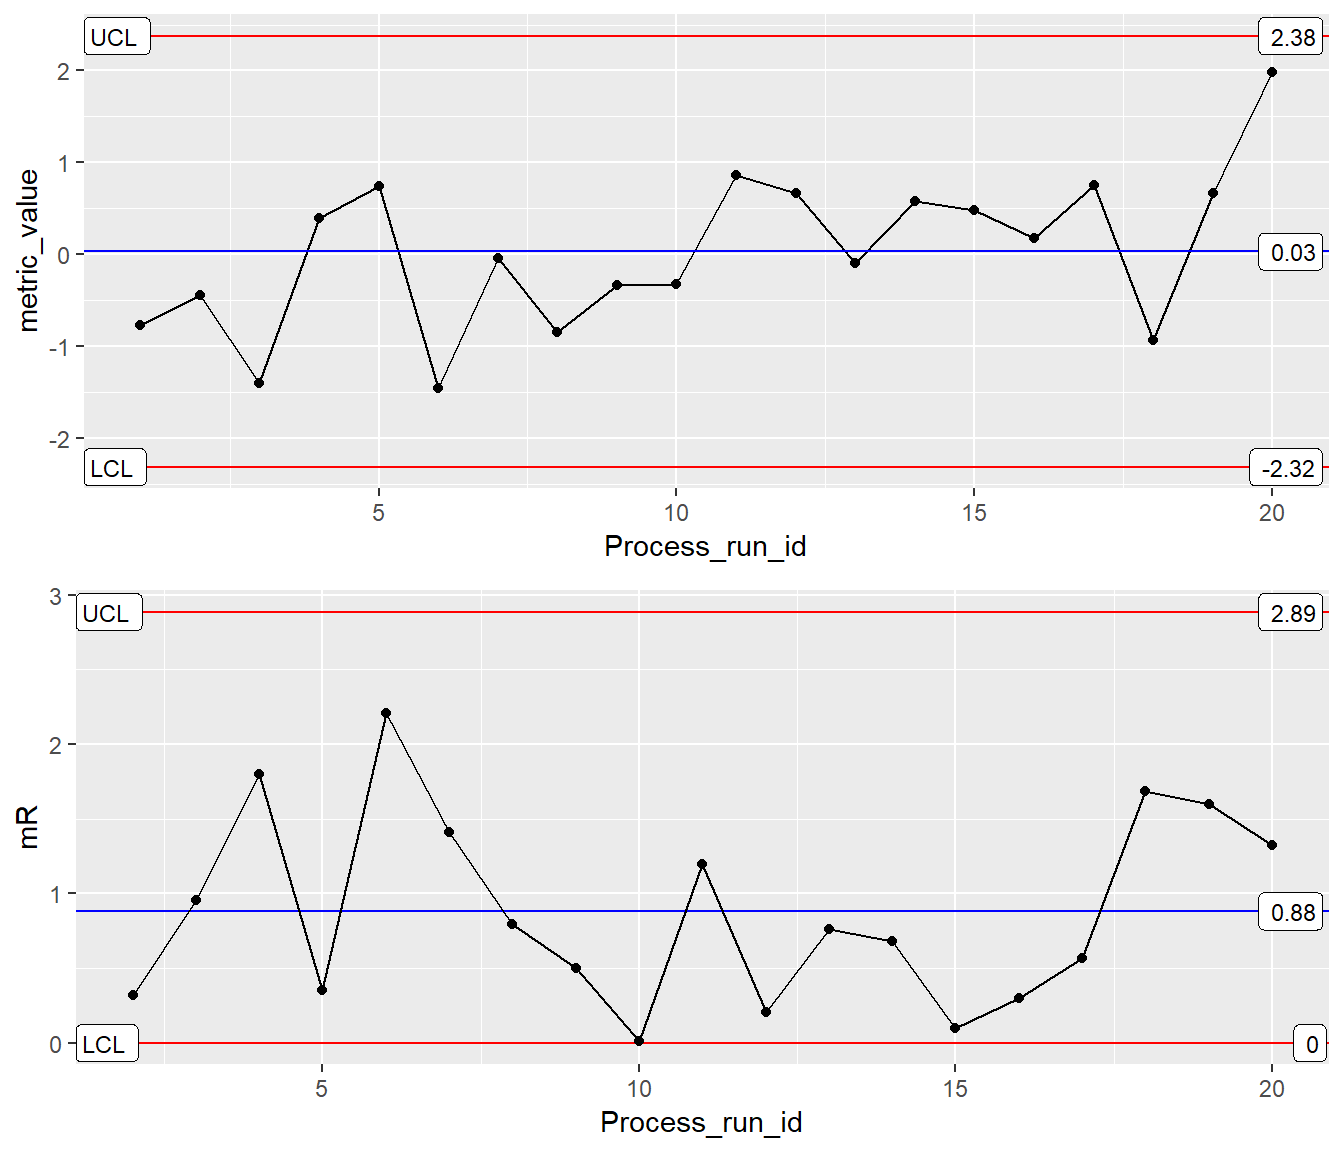
Example 2 : Xbar & R
Setup
set.seed(5555)
Process1 <- data.frame(processID = as.factor(rep(1,30)),
                       metric_value = rnorm(30,0,1),
                       subgroup_sample=rep(letters[1:10], each = 3),
                       Process_run_id = 1:30)

ggXbarR <- ggplot(Process1, aes(x=subgroup_sample, y = metric_value, group=1))
Xbar & R Chart
Xbar <- ggXbarR +
        stat_QC(method = "xBar.rBar", auto.label = T, label.digits = 2)

R <- ggXbarR +
      stat_QC(method = "rBar", auto.label = T, label.digits = 2) +
      ylab("R-bar")

grid.arrange(Xbar, R, ncol=1)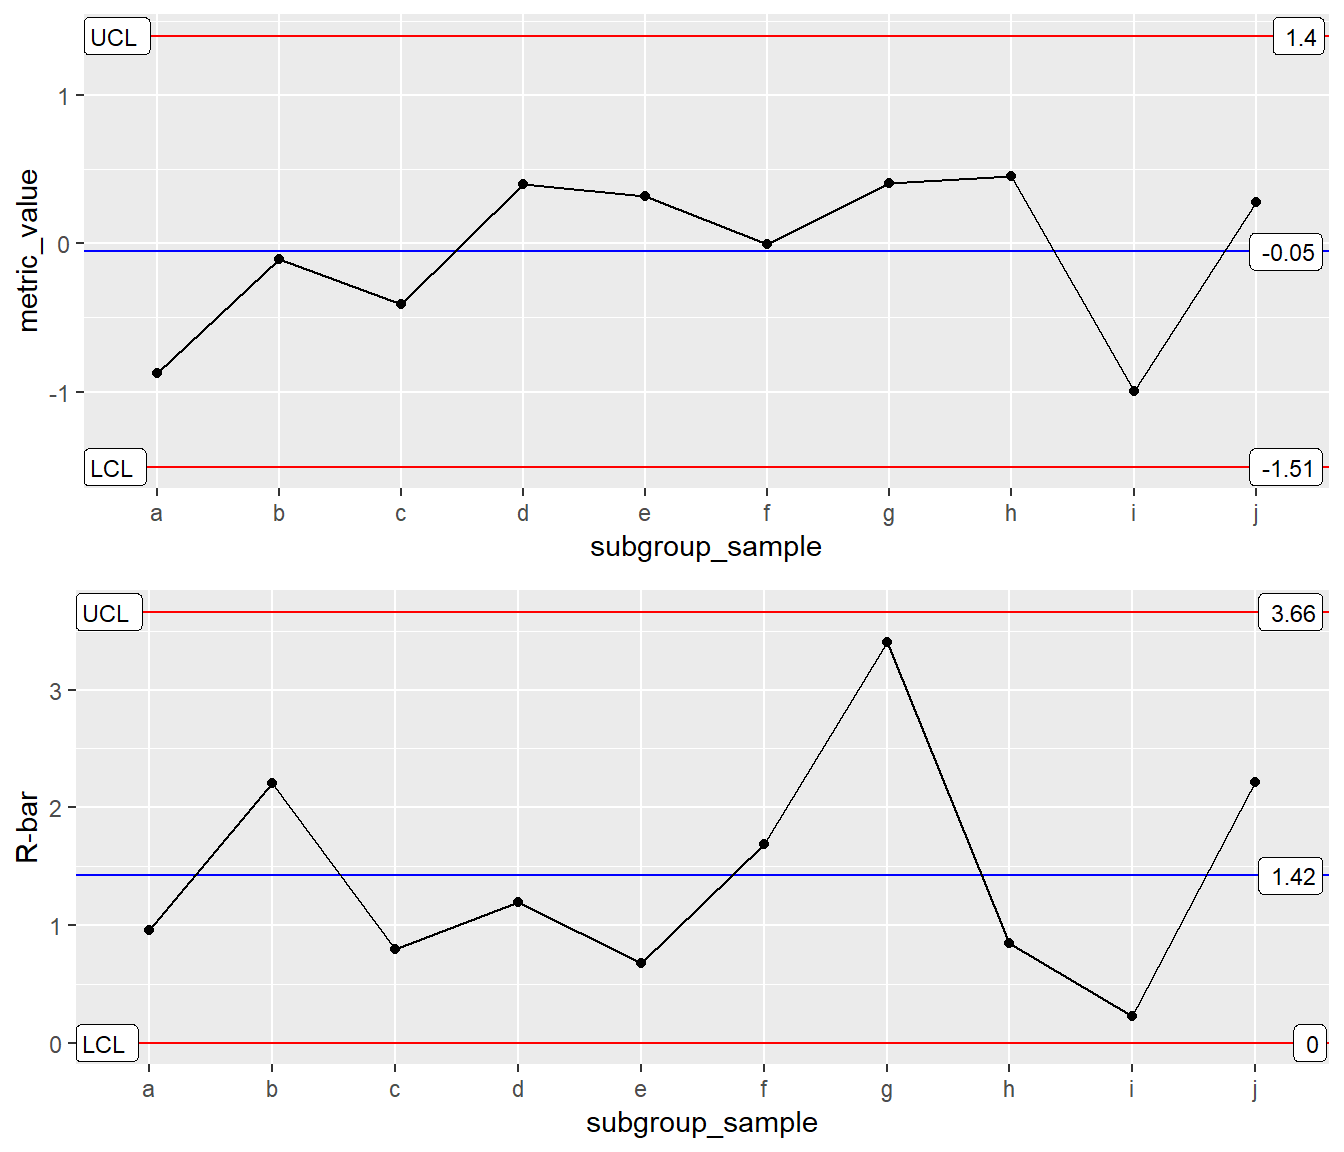
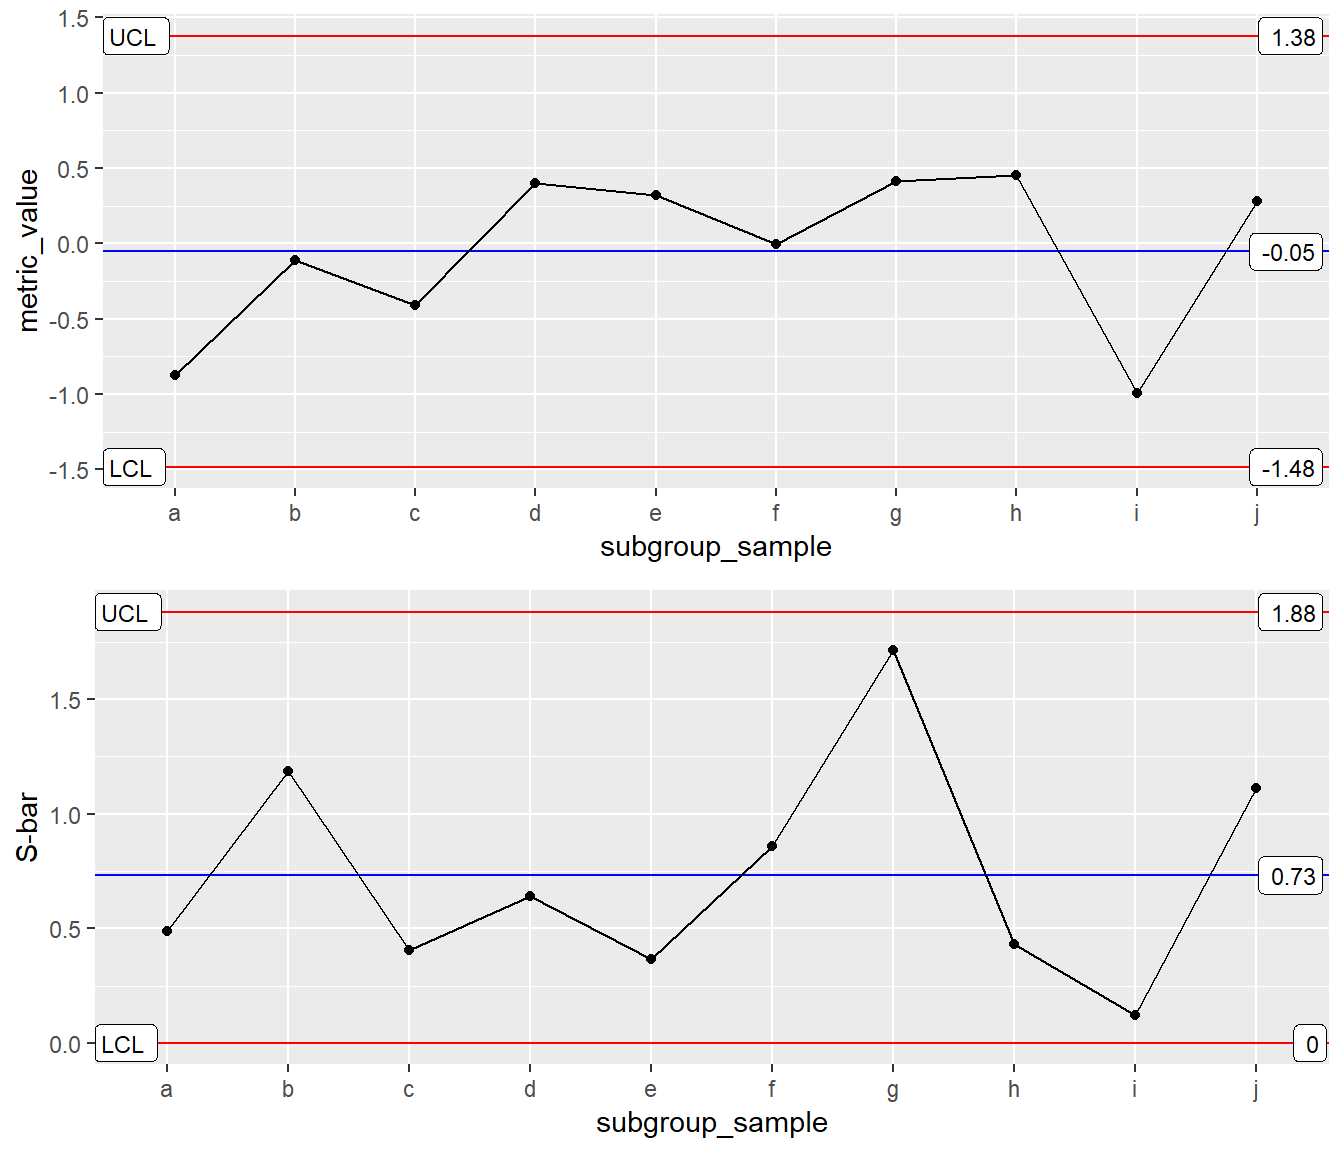
Example 3 : Xbar & S
Setup
set.seed(5555)
Process1 <- data.frame(processID = as.factor(rep(1,30)),
                       metric_value = rnorm(30,0,1),
                       subgroup_sample=rep(letters[1:10], each = 3),
                       Process_run_id = 1:30)

ggXbarR <- ggplot(Process1, aes(x=subgroup_sample, y = metric_value, group=1))
Xbar & S Chart
Xbar <- ggXbarR +
        stat_QC(method = "xBar.sBar", auto.label = T, label.digits = 2)

S <- ggXbarR +
      stat_QC(method = "sBar", auto.label = T, label.digits = 2) +
      ylab("S-bar")

grid.arrange(Xbar, S, ncol=1)